
Figures & data
Figure 1. Footprints of distance indicator surveys – the DIRECT (cyan squares) and the WFCAM/INT (red square) surveys. .
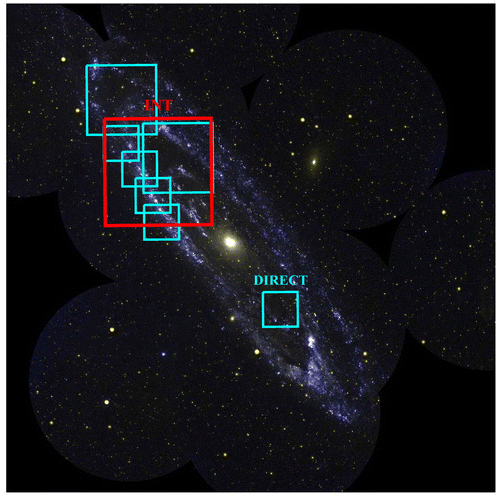
Figure 2. Footprints of high-cadence microlensing surveys – the POINT-AGAPE (green squares), WeCAPP (yellow square), and POMME (red squares) survey. .
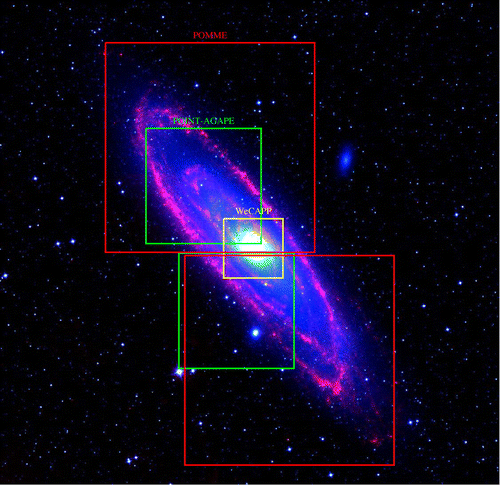
Figure 3. Variables from POINT-AGAPE surveys.
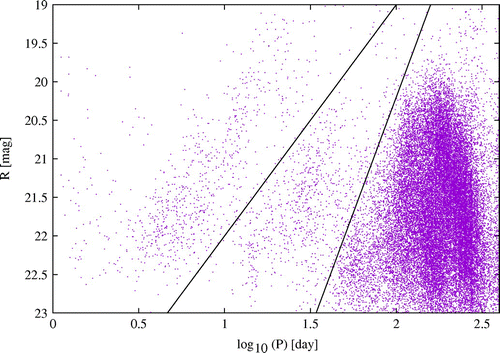
Figure 4. Classical Cepheids PL relation. Left: r-band mean-phased photometry from ground-based PS1 telescope. The photometry is heavily effected by the blending effects. Right: J-band random-phased photometry from Hubble Space Telescope. The exquisite spatial resolution delivered by HST enables us to get rid of the blending effects.
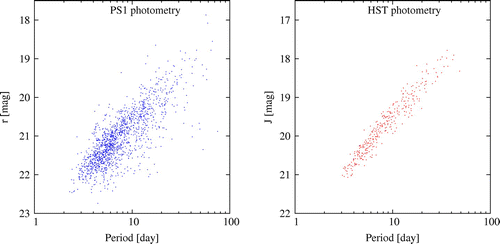
Figure 5. Beat Cepheids in M31, M33, Milky, and Magellanic Clouds. Left panel: period v.s. period ratio of the beat Cepheids over-plot on the lowest possible metallicity tracks. Right panel: period v.s. period ratio of the beat Cepheids over-plot on the highest possible metallicity tracks.
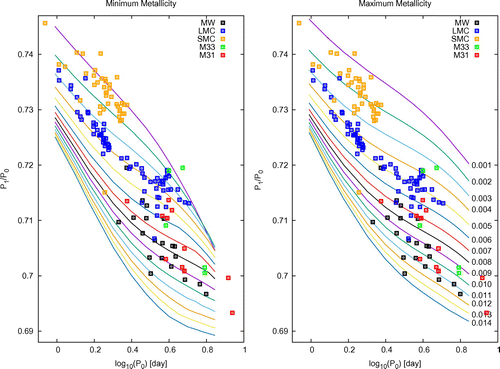
Figure 6. Radial velocity and light curves of the 2 eclipsing binaries used by Ribas et al. [Citation20] (left) and Vilardell et al. [Citation21] (right) to derive an independent, direct M31 distance to 4%.
![Figure 6. Radial velocity and light curves of the 2 eclipsing binaries used by Ribas et al. [Citation20] (left) and Vilardell et al. [Citation21] (right) to derive an independent, direct M31 distance to 4%.](/cms/asset/13929572-e414-44eb-bb2d-9b233c6f7fde/tare_a_1270028_f0006_oc.gif)
Figure 7. R Coronae Borealis light curve from AAVSO.
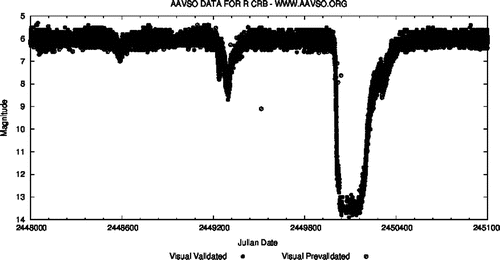
Figure 8. Microlensing light curve of POINT-AGAPE-S3/WeCAPP-1. Data points are POINT-AGAPE r-band (green), POINT-AGAPE i-band (orange), WeCAPP R-band (blue), and WeCAPP I-band (red).
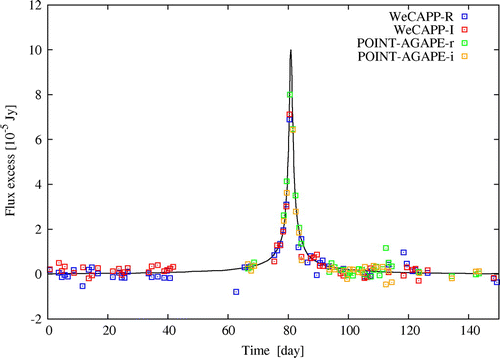
Figure 9. An M31 exoplanet microlensing candidate light curve in (upper),
(middle), and
-band (bottom panel), over-plotted with the best-fit binary lens model C1 with a mass ratio of 0.014 [Citation83].
![Figure 9. An M31 exoplanet microlensing candidate light curve in (upper), (middle), and -band (bottom panel), over-plotted with the best-fit binary lens model C1 with a mass ratio of 0.014 [Citation83].](/cms/asset/c6360985-7508-45ca-92c5-4c119da126ab/tare_a_1270028_f0009_oc.gif)
Figure 10. Upper panel: light curves of S-type novae. Lower panel: light curves of C-type novae.
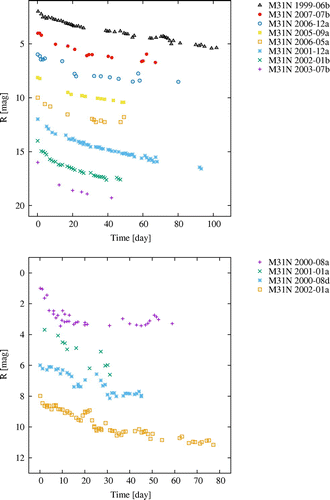
Figure 11. Upper panel: light curve of an M31 J-type nova (M31N 2001-10a). Lower panel: time intervals between the peak of successive jitters v.s. time intervals between each jitter and the time of eruption. There is a trend in the log–log plot, consistent with the hydrogen burning envelope instabilities scenario [Citation102].
![Figure 11. Upper panel: light curve of an M31 J-type nova (M31N 2001-10a). Lower panel: time intervals between the peak of successive jitters v.s. time intervals between each jitter and the time of eruption. There is a trend in the log–log plot, consistent with the hydrogen burning envelope instabilities scenario [Citation102].](/cms/asset/65e0b130-439a-4d7e-9f6b-1e3b8008ae38/tare_a_1270028_f0011_oc.gif)
Figure 12. The infrared PL relation as seen from M31. The sample is obtained from LMC long-period variables, with magnitudes scaled to the distance of M31. We can see several long-period variable tracks, such as A, B, C, and D as shown in Ita et al. (2004, [Citation105]), are all brighter than K = 19 mag, hence feasible with 4-m class telescopes on the ground.
![Figure 12. The infrared PL relation as seen from M31. The sample is obtained from LMC long-period variables, with magnitudes scaled to the distance of M31. We can see several long-period variable tracks, such as A, B, C, and D as shown in Ita et al. (2004, [Citation105]), are all brighter than K = 19 mag, hence feasible with 4-m class telescopes on the ground.](/cms/asset/5e882a47-b73f-4a40-843d-c4f738578844/tare_a_1270028_f0012_oc.gif)