Figures & data
Table 1. Properties of the major satellites in our solar system and their modes of origin.
Figure 1. Satellites of our Solar System’s planets (dots), as a function of satellite-to-planet mass ratio (left), and ratio of total angular momentum in the orbital motion of the satellites, to the total system angular momentum,
[Citation147].
![Figure 1. Satellites of our Solar System’s planets (dots), as a function of satellite-to-planet mass ratio (left), and ratio of total angular momentum in the orbital motion of the satellites, to the total system angular momentum, [Citation147].](/cms/asset/b0bbe041-89f7-4615-b225-1b4f461f9f1b/tare_a_1279469_f0001_b.gif)
Figure 2. CTH simulation of the Moon-forming impact, after Canup et al. (2013) [Citation76]; details about the simulation method, equations of state, and data analysis may be found in this reference.
![Figure 2. CTH simulation of the Moon-forming impact, after Canup et al. (2013) [Citation76]; details about the simulation method, equations of state, and data analysis may be found in this reference.](/cms/asset/194c4efb-2556-4e1f-b509-eb254299c809/tare_a_1279469_f0002_oc.gif)
Figure 3. Reproduced with permission from Kokubo et al. (2000) [Citation78]. Time-evolution of a gas-free disk of debris after the Moon-forming impact (simulation 15a). Four lunar masses of material is initially distributed in a region 2 Roche radii from the Earth (about 6 Earth radii).
![Figure 3. Reproduced with permission from Kokubo et al. (2000) [Citation78]. Time-evolution of a gas-free disk of debris after the Moon-forming impact (simulation 15a). Four lunar masses of material is initially distributed in a region 2 Roche radii from the Earth (about 6 Earth radii).](/cms/asset/977a267e-9651-4b90-a8d7-3bd0a7518888/tare_a_1279469_f0003_b.gif)
Figure 4. Reproduced, with permission from Figure of [Citation68]. Snapshots of the gas-free accretion of solid debris after an impact between two rock/metal planets. The disk initially contains 1.25 lunar masses of material, with specific angular momentum . Results are shown looking down onto the disk from above.
![Figure 4. Reproduced, with permission from Figure 5 of [Citation68]. Snapshots of the gas-free accretion of solid debris after an impact between two rock/metal planets. The disk initially contains 1.25 lunar masses of material, with specific angular momentum . Results are shown looking down onto the disk from above.](/cms/asset/b729b55e-4485-427d-8266-624d3b8d792e/tare_a_1279469_f0004_oc.gif)
Figure 5. Reproduced with permission from Canup (2005) [Citation17]. Time-evolution of a smoothed particle hydrodynamics simulation of a potential Pluto-Charon-forming impact between two pure serpentine objects (run20 in Table 1 of Canup (2005)).
![Figure 5. Reproduced with permission from Canup (2005) [Citation17]. Time-evolution of a smoothed particle hydrodynamics simulation of a potential Pluto-Charon-forming impact between two pure serpentine objects (run20 in Table 1 of Canup (2005)).](/cms/asset/a49cc060-06d3-4cf3-beea-3957255bde6f/tare_a_1279469_f0005_oc.gif)
Figure 6. Reproduced, with permission from Figure of Tanigawa et al. (2012) [Citation107]. (left) Colors indicate values of the potential relative to Lagrange points L and L
.
![Figure 6. Reproduced, with permission from Figure 2 of Tanigawa et al. (2012) [Citation107]. (left) Colors indicate values of the potential relative to Lagrange points L and L.](/cms/asset/4e710466-4ae2-4fc0-a0bf-6e9c7dae4b9c/tare_a_1279469_f0006_oc.gif)
Figure 7. Schematic of the gas-starved disk, based on models of Canup & Ward (2002, 2006) [Citation27,Citation30]. Ice/rock particles + gas from the solar nebula deliver mass to .
![Figure 7. Schematic of the gas-starved disk, based on models of Canup & Ward (2002, 2006) [Citation27,Citation30]. Ice/rock particles + gas from the solar nebula deliver mass to .](/cms/asset/d95d2964-0fdf-49d7-a210-630c6513127a/tare_a_1279469_f0007_b.gif)
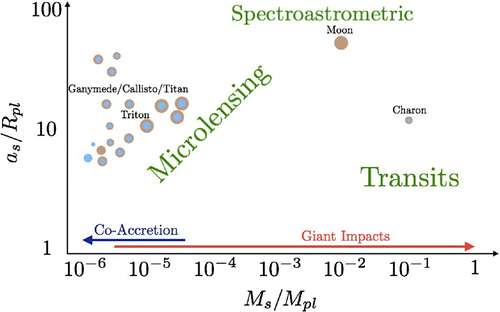
Figure 8. Schematic depicting the power of microlensing, spectroastrometric, and transit exomoon detection and characterization methods, as a function of satellite-to-planet mass ratio, and satellite semi-major axis.

Figure 9. Reproduced, with permission, from Kipping 2014 [Citation142]. Schematic illustration of the effect of an orbiting moon on the timing and duration of planetary transits.
![Figure 9. Reproduced, with permission, from Kipping 2014 [Citation142]. Schematic illustration of the effect of an orbiting moon on the timing and duration of planetary transits.](/cms/asset/17d29f8a-0855-4fd4-94ae-02aed2331915/tare_a_1279469_f0009_oc.gif)
