
Figures & data
Figure 1. Level of symptoms in Long COVID by grouping the results (in percent of predicted values). The diagram contains six graphs showing the results in Forced Vital Capacity (FVC), Forced Expiratory Volume in One second (FEV1), Maximal Inspiratory Pressure (MIP), Maximal Expiratory Pressure (MEP), physical capacity (Phys cap), and thoracic expansion (Thx exp).
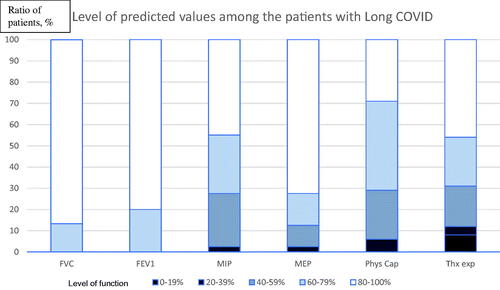
Table 1. Results of included tests. Results are presented as percent predicted (mean and standard deviation) or n (%).
Table 2. Respiratory movements in patients undergoing test with RMMI. Mean of both sides.
Supplemental material
Supplemental Material
Download MS Word (36.7 KB)Data availability statement
All data generated or analysed during this study were included in this published article and its supplementary information file.