Figures & data
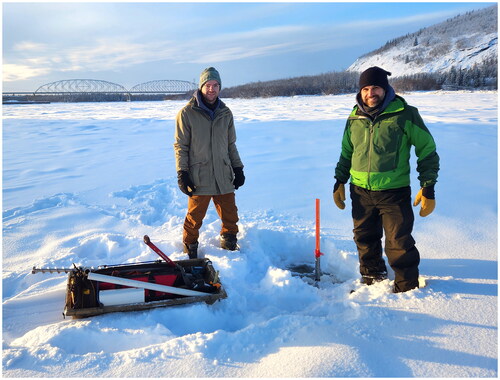
Figure 1. Sediment, Ice and Learning on the Tanana (SILT) educational model.
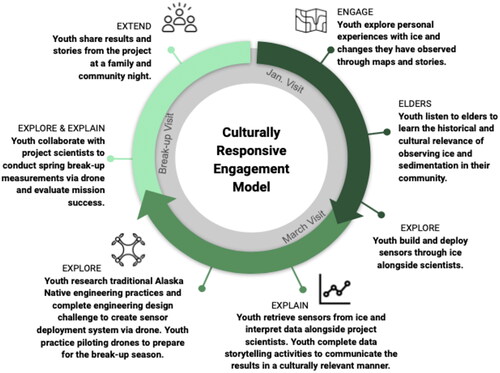
Figure 2. SILT youth workshop series design. Workshops were held in January, March, and April 2023.
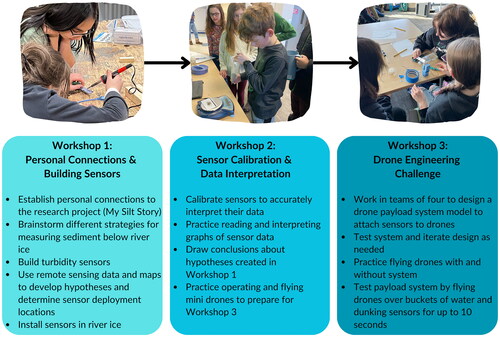
Table 1. The workshop series aligned with standards from the Next Generation Science Standards and the Alaska Standards for Culturally Responsive Schools.
Figure 3. Before constructing turbidity sensors, students recorded their own ideas about how to observe and measure sediment underneath river ice. Top left: text reads “Cut holes in ice, take samples of water and silt mix in different spots, find the ratio of water to silt by filtering out water and silt, compare other spots.” Top right: an image of a drone lowering a tool into the water. Bottom left: a sensor sending signals into the water and collecting data. Bottom right: text reads “Radio connection, send signals, Timed released container, take in silt, take back to study.”
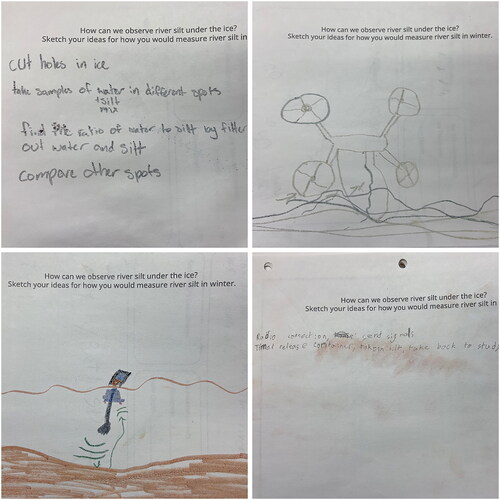
Figure 4. SILT scientist T. Langhorst showcases a version of the assembled turbidity sensor.
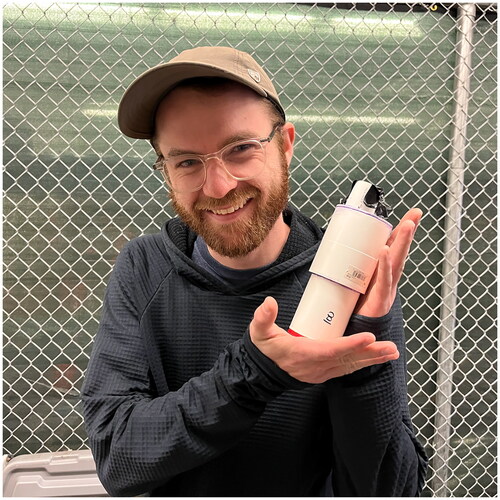
Figure 5. The turbidity sensors were housed in metal pipes (left) and fitted with bright orange stakes for visibility and safety on the Tanana River (top and bottom right).
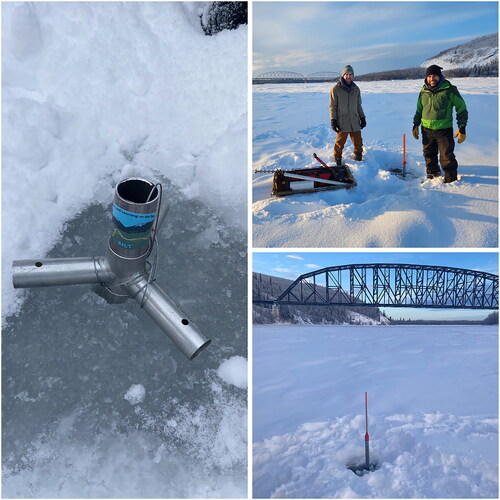
Figure 6. Students drew their ideas for a payload system (top left) and used a variety of materials (top right) to construct and iterate their designs (bottom left and right).
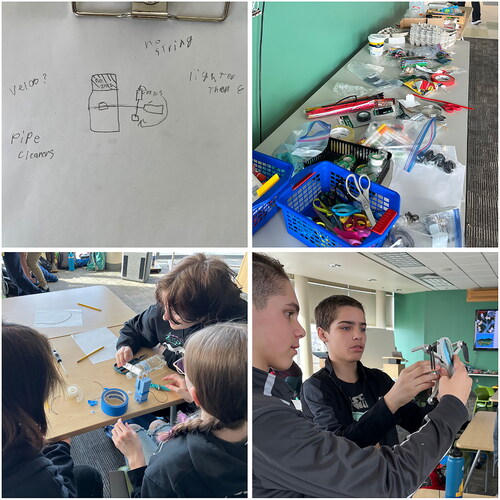
Figure 7. Students’ science interest and science self-efficacy scores measured in a pre-program survey, a retrospective pre-program survey (administered after the last workshop), and a post-program survey.
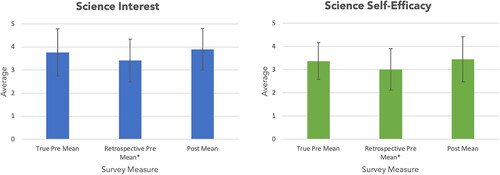
Table 2. Aspects of the SILT workshop series that promoted students’ science identities.
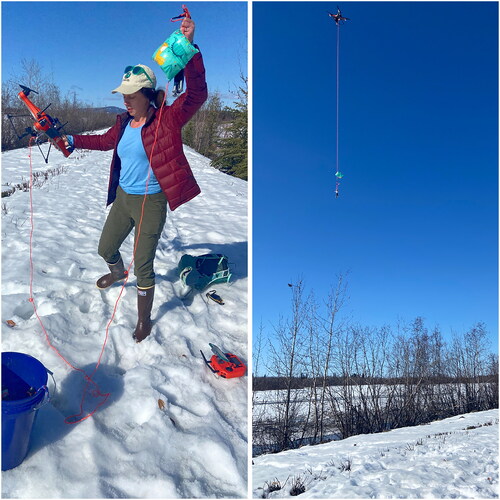
Figure 8. Left: SILT scientist J. Davis untangles the line connecting the drone to the turbidity sensor to prepare for the next test flight with the water wing flotation device prominently displayed. Right: The drone in flight with the water wing flotation device clearly visible.