
Article title: Comparison of canola oil and olive oil consumption on the serum lipid profile in adults: a systematic review and meta-analysis of randomized controlled trials
Authors: Behnaz Pourrajab, Elham Sharifi-Zahabi, Sepideh Soltani, Hossein Shahinfar, and Farzad Shidfar
Journal: Critical Reviews in Food Science and Nutrition
DOI: http://dx.doi.org/10.1080/10408398.2022.2100314
When this article was published online, - have been typeset incorrectly.
Figure 2. Risk of bias of the included studies. + shows a low risk, - shows a high risk and ? shows unclear risk of bias.
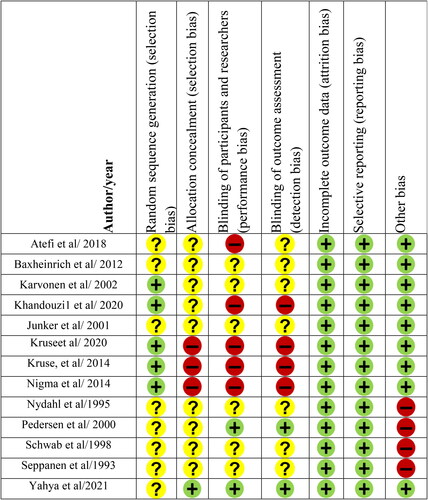
Figure 3. Forest plot of randomized controlled trials investigating the comparison of canola oil and olive oil consumption on the serum HDL-c.
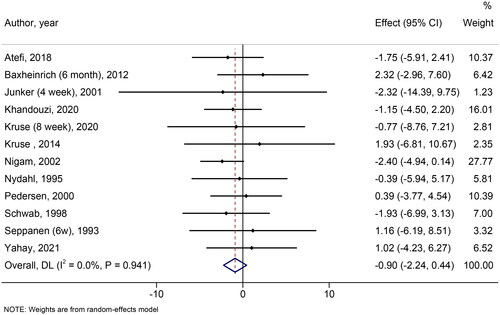
Figure 4. Forest plot of randomized controlled trials investigating the comparison of canola oil and olive oil consumption on the serum LDL-c.
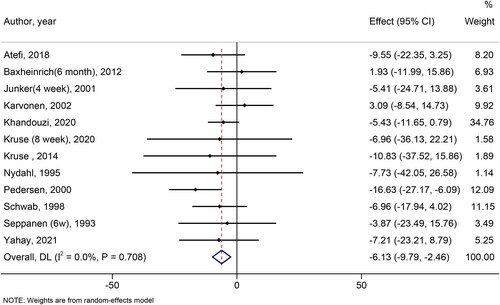
Figure 5. Forest plot of randomized controlled trials investigating the comparison of canola oil and olive oil consumption on the serum TC.
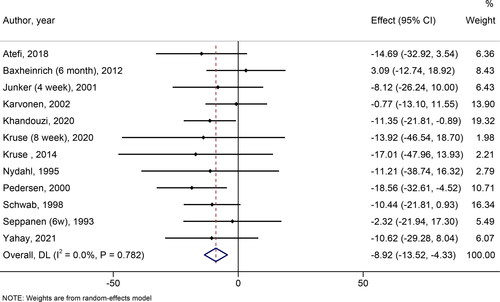
Figure 6. Forest plot of randomized controlled trials investigating the comparison of canola oil and olive oil consumption on the serum TG.
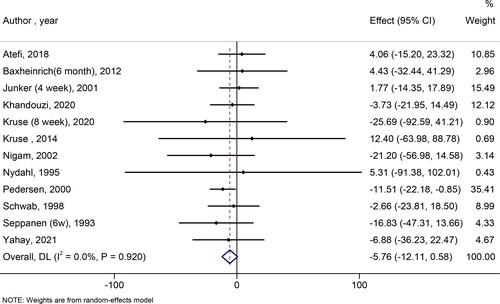
Figure 7. Forest plot of randomized controlled trials investigating the comparison of canola oil and olive oil consumption on the serum TC/HDL-c ratio.
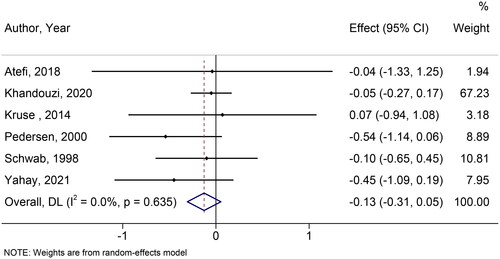
Figure 8. Forest plot of randomized controlled trials investigating the comparison of canola oil and olive oil consumption on the serum LDL-c/HDL-c ratio.
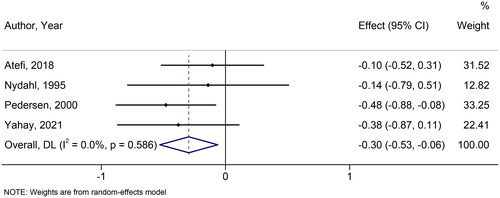
Figure 9. Forest plot of randomized controlled trials investigating the comparison of canola oil and olive oil consumption on the serum VLDL-c.
Now, these have been corrected and republished online.