
 ?Mathematical formulae have been encoded as MathML and are displayed in this HTML version using MathJax in order to improve their display. Uncheck the box to turn MathJax off. This feature requires Javascript. Click on a formula to zoom.
ABSTRACT
Changes in crop mix significantly affect the carbon emissions from cropping systems, thus underscoring their importance in achieving sustainable agriculture development. This article aims to offer new insights into the relationship between crop mix changes and carbon emissions from cropping systems. Based on provincial statistical data on crop production, this study analyzed the spatiotemporal dynamics of crop mix and the subsequent effect on the carbon emissions from cropping systems in China from 2005 to 2020. The crop-mix type identification rules, emission-factor approach, and grey incidence analysis were applied. The results showed clear changes in crop mix and obvious transitions from grain crops to cash crops in southern provinces. Among crops, the abundance of maize, vegetables, and melons increased remarkably. Besides, the carbon emission intensity (CI) from cropping systems generally showed an upward trend in most provinces, with a spatial pattern of gradual decrease from southeast to northwest. The changes in CI were most closely correlated with rice, maize, vegetables, and melon, with coefficients of 0.808, 0.773, 0.814, and 0.792, respectively. Additionally, the growth of maize and vegetables ratios played a significant role in the CI increases in most provinces. To optimize crop cultivation and mitigate carbon emissions, possible strategies including rational crop production layout, land transfer, and clean production technologies were proposed.
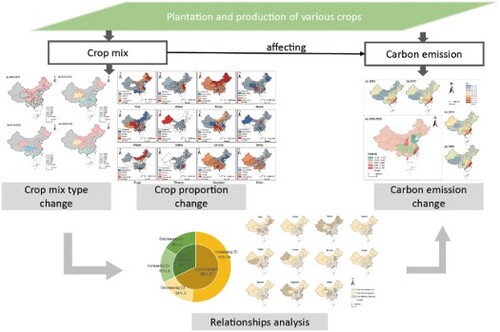
GRAPHICAL ABSTRACT
1. Introduction
The rapid development of the social economy has led to significant transformations in agricultural production and society’s demand for crops (Delpeuch & Leblois, Citation2014; Kumar & Joshi, Citation2016). Consequently, there have been substantial changes in crop cultivation worldwide. The expansion of cash crops, including rubber, palm oil, nursery, fruits, and tea, has become a prominent phenomenon in tropical and subtropical areas (Abram et al., Citation2017; Ahrends et al., Citation2015; Carlson et al., Citation2012; Su et al., Citation2017). In some regions, cash crops are even cultivated at the expense of traditional grain crops (Rubhara et al., Citation2020). On the other hand, some areas have witnessed growth in grain crops. For example, soybeans in Brazil have expanded significantly due to the growing market demand (Gollnow et al., Citation2018).
The transformations in agricultural production and crop cultivation can yield extensive and complicated effects on the environment (Hua et al., Citation2021; Rubhara et al., Citation2020; Shackelford et al., Citation2019). Agricultural activities are responsible for a substantial portion of total carbon emissions in many countries (Robertson et al., Citation2000). Farming contributes approximately 20% of global carbon dioxide (CO2) emissions (Lu et al., Citation2018). Moreover, the agricultural sector serves as a large producer of nitrous oxide (N2O) and methane (CH4), both having high global warming potentials (Tang et al., Citation2016). Research has indicated that crop cultivation is a major source of greenhouse gas emissions (GHGs) (Huang et al., Citation2017; Tubiello et al., Citation2013), which will inevitably exacerbate global temperature rise. This poses a challenge to current global carbon mitigation efforts and the reduction targets of many countries.
However, the sustainable transition of agriculture must address the challenge of increasing food production without causing environmental harm (Clay, Citation2011; Tilman et al., Citation2002). Sustainable intensification (SI) has gained widespread acceptance as a viable solution and is in alignment with the Sustainable Development Goals (SDGs). SI in agriculture is an approach that entails enhancing the efficient utilization of agricultural resources to boost food production while reducing negative environmental and social impacts (Garnett et al., Citation2013). Effective management of plantations and cropping systems is one of the most important practices for achieving agricultural sustainable intensification (Pretty & Bharucha, Citation2014). Cash crop production and management have attracted much attention owing to their sustainable characteristics (Cayambe et al., Citation2023), with a mixed crop system being considered more sustainable due to its favourable effects on efficiency and ecology (Lienhard et al., Citation2020). Studies also advocate for increasing crop diversity to provide a wider array of foods while reducing environmental risks (Hunter et al., Citation2017). In the context of sustainable agricultural production, the cropping system plays a crucial role in reducing carbon emissions. The characteristics of the crop mix will continually influence carbon emissions from agricultural practices and their contribution to cleaner production. Thus, considerable mitigating efforts within the cropping sector are required. Comprehensively understanding the changing characteristics of crop mix and its effect on carbon emissions holds significant policy importance for optimizing cropping systems and achieving sustainable agriculture on both national and international scales.
As a nation with a vast agricultural base, China has witnessed profound changes in its cropping systems in recent decades, shifting from an emphasis on ‘grain as the key’ to a strategy of ‘co-development of grain and cash crop’. The area ratio of grain crops has decreased from 88.6% in the 1950s to approximately 69% today, while the area ratio of cash crops has steadily risen and the crop diversity has been increasing (National Data, Citation2022). In addition, crop cultivation is a major source of greenhouse gas emissions in China. According to Li et al. (Citation2011), carbon emissions from cropland account for 17% of the total anthropogenic emissions. To address this pressing climate challenge, China has responded to the international call for emission reduction and has implemented various measures to decrease agricultural carbon emissions. The 14th Five-Year Plan for The Green Development of Agriculture recently identified the imperative of promoting carbon emission reduction through the adoption of green practices in cropping systems.
Against this background, it is necessary to conduct further research on the long-term crop mix changes and their effects on carbon emissions. To address this, our study used a long-time series of agricultural production statistics to analyze the dynamic characteristics of crop mix and the carbon emissions from cropping systems across 31 provinces in China over a 15-year period and further measured their relationship. This study aimed to (1) reveal the spatial–temporal dynamics of the crop mix in China; (2) estimate the carbon emissions from the cropping systems and their changing characteristics; and (3) explore the effects of changes in crop cultivation on carbon emissions and their spatial heterogeneity. Compared to previous literature, our study has made several contributions. First, we proposed a rule for identifying shifts in crop-mix types and revealed its spatiotemporal heterogeneity. This provides a novel perspective to understand the evolving nature of the cropping system in China, surpassing the limitations of existing research reliant on ratio-based approaches. Second, we utilized Grey Incidence Analysis to estimate the correlation between different crops and carbon emissions across various regions, addressing the spatial variability in crops’ carbon contributions that previous studies failed to capture due to data limitations. Finally, our study comprehensively revealed the different correlations between various crops and carbon emissions, serving as an extension to the existing literature. Although the exploration was based on some assumptions due to data limitations, the findings are expected to deepen insights into sustainable agricultural management from the perspective of cropping systems. Additionally, they provide references for potential strategies aimed at optimizing crop mix and promoting sustainable agriculture in China and beyond.
The rest of this study is organized as follows: Section 2 reviewed and analyzed the literature. Section 3 presented the data and methods applied. Section 4 reported the results. Section 5 discussed the findings and provided policy implications, while Section 6 concluded the research.
2. Literature review
In previous literature, changes in crop mix have aroused wide attention in the fields of land-use science, agricultural science, geography, and ecological economics. Studies have primarily focused on the proportional distribution of various crops and analyzed their spatiotemporal characteristics (Jin, Citation2019; Liu et al., Citation2018a). Additionally, crop diversity has also been investigated as another perspective (Conrad et al., Citation2017; Isbell et al., Citation2021; Song et al., Citation2021). In terms of methodology, remote sensing data and spatial analysis methods have been extensively employed to capture and describe crop spatial patterns (Dong et al., Citation2013; Wilken et al., Citation2017; Xiao et al., Citation2015). However, remote sensing methods may have limitations in conducting long-term and large-scale studies (Su et al., Citation2019). Besides, other studies have examined the dynamics of crop mix based on administrative statistical data (An et al., Citation2021; Jin, Citation2019) or household survey data (Vongvisouk et al., Citation2014).
GHGs from agriculture and cropping systems have long been a focal topic for researchers. For example, Magazzino et al. (Citation2023a) investigated the relationship between agricultural land use and greenhouse gas emissions, and Skiba et al. (Citation2020) pointed out that the rapid expansion of oil palm in southeast Asia has been a major source of NOx over recent decades. Changes in crop mix also led to notable shifts in carbon emissions from crop cultivation, with various approaches adopted for measurement. The life cycle method, which considers the overall agricultural inputs used throughout the crop production and protection cycle, has been commonly applied (Adler et al., Citation2007; Xu et al., Citation2013). Carbon footprint (CF) has also been recognized as a valuable indicator for analyzing changes in carbon emissions (Knudsen et al., Citation2014; Pathak et al., Citation2010; Yang et al., Citation2014). Notable findings regarding changes in carbon emissions from cropping systems were provided. Research conducted in China indicated that GHGs from agricultural production increased by 16% due to the rise in crop production between 2000 and 2015 (Liu et al., Citation2018b).
Carbon emissions can be driven by various factors (Magazzino et al., Citation2023b). Previous research has identified the use of agricultural production materials as the primary influencing factor on how crop production affects carbon emissions (West & Marland, Citation2002; Zhang et al., Citation2017). Studies have pointed out that irrigation, fertilizers, pesticides, and machinery usage are all significant sources of carbon emissions (Cheng et al., Citation2011; Zhang et al., Citation2017), with fertilization and irrigation particularly considered as key contributors (Jiao et al., Citation2018). Concerning specific crops, research has shown that the growing proportion of cash crops such as oil palm, soybean, and sugarcane has resulted in elevated agricultural carbon emissions (Ceddia, Citation2020). Chen et al. (Citation2021), on a national scale, found that maize, fruits, and vegetables were the main contributors to the rise in carbon emissions from the cropping system. This underscores a strong connection between the expansion of cash crops and carbon increase.
Theoretically, greenhouse gases from cropping systems as undesired outputs, can come from both arable soils and indirectly from the materials input (Fuentes-Ponce et al., Citation2022). Concerning direct emissions, as different crops exhibit distinct growth traits, factors such as crop types, topology, and diversity are inextricably related to carbon loss from cropland. Consequently, the characteristics of the cropping system will influence the changes in CO2 emitted into the atmosphere. Regarding indirect emissions, the heterogeneous input characteristics among crops lead to varying total input patterns under different crop mix conditions, subsequently influencing the indirect emissions generated. Cash crops typically entail higher energy consumption and contribute more to GHGs than grain crops (Jianyi et al., Citation2015; Li et al., Citation2023). Therefore, alternations in cropping systems and activities can result in changes in the energy and materials input, consequently impacting GHGs (Liu et al., Citation2018b). In general, changes in cropping systems can affect agricultural carbon emissions both directly and indirectly.
Overall, current research still lacks a perspective on crop-mix types when characterizing the evolution of cropping systems. For carbon emissions, literature has primarily focused on the influential role of agricultural materials and economic factors, with little attention paid to the impact of crop mix. Although some studies have analyzed the contributions of various crops, they have mainly focused on portion analysis, with the spatial differences rarely investigated. This study will fill the gaps and provide novel insights in this field.
3. Materials and methods
3.1. Data and processing
Data used in this study, including the area of various crops, the agricultural production conditions, and the consumption of agricultural materials (diesel, pesticide, fertilizer, electricity, and agricultural film), were obtained from China Statistical Yearbook, China Rural Statistical Yearbook, and provincial statistical yearbooks from 2006 to 2021(https://data.cnki.net/yearBook). As the yearbooks provide information from the previous year, the data utilized in this study covered the period from 2005 to 2020. A description of the data used is presented in . Owing to data limitations, Hong Kong, Macau, and Taiwan were excluded from this study. The maps depicting administrative division, geographical division, and main grain-producing provinces (Xu et al., Citation2021) are provided in . All the data analysis and the results layout were carried out using ArcGIS 10.4 and Excel 2019.
Figure 1. Geographical divisions and main grain-producing provinces of China. Note: it is produced by authors in ArcGIS 10.4.
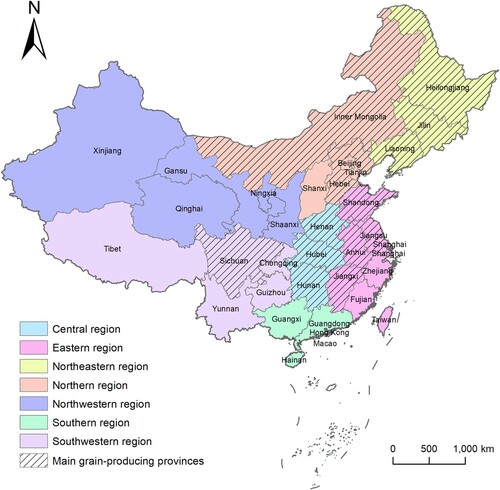
Table 1. Description of the data used.
3.2. Methods
3.2.1. Crop-mix type analysis
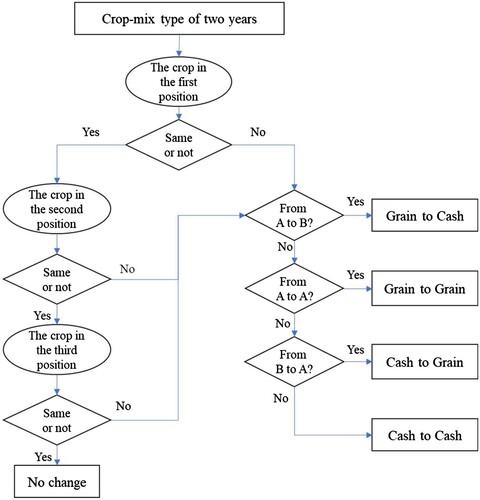
Based on agricultural statistics, this study encompassed 12 crops: rice, wheat, maize, beans, potatoes, cotton, oil crops, hemp, sugar, tobacco, vegetables, and melons. Among these, rice, wheat, maize, beans, and potatoes are categorized as grain crops, while the remainder are considered cash crops. The several major crops cultivated will be representative of the regional cropping preference. Hence, based on the identification methods used by An et al. (Citation2021), we have modified the rules for defining the crop-mix type as follows: (1) the crops whose cultivated area accounts for more than 30% of the total cultivated areas are combined in proportional order; (2) if the proportions of crops are all under 30%, the top three with the largest proportion are selected to combined in sequence as the crop mix type; (3) grain crops are coded as A, and cash crops are coded as B; (4) a single-crop type is coded as the same crop in all three positions, while a double-crop type is coded with the second and third position identical (e.g. the type of rice is coded as A-A-A, and rice-vegetable is coded as A-B-B).
Then, the following flowchart () was formulated to analyze the changes in crop-mix types over a period, and the changing patterns included No Change (NC), Grain to Cash (GTC), Grain to Grain (GTG), Cash to Grain (CTG), and Cash to Cash (CTC).
Figure 2. Flowchart of analyzing crop-mix type changes. Note: it is produced by authors in Visio 2019.
3.2.2. Trend analysis
Linear fitting analysis was used to quantify the trends of various crops and carbon emissions in each province according to existing research (Liu et al., Citation2018a). This approach enables us to get a handle on the general trend of the study object over time. A negative slope coefficient (S) indicates a decreasing trend, while a positive coefficient signifies an increasing trend. A large absolute value of the coefficient suggests a great degree of change. If the regression coefficient passes the significance testing (at p < 0.1), then the trend is considered significant. The coefficient (S) was calculated as follows:
(1)
(1) where S represents the coefficient of trend, t is the year; n is the number of years in the study period, and Xt denotes the proportion of crop or carbon emission for year t.
3.2.3. Estimation of carbon emissions
Agriculture serves as an important source of three primary greenhouse gases (GHGs): CO2, CH4, and N2O (Johnson et al., Citation2007). These emissions can originate from various agricultural production materials and croplands with different crops cultivated (Meng et al., Citation2023). Agricultural practices involving the use of pesticides, chemical fertilizer, diesel oil, and plastic film can result in large amounts of CO2 emissions. Additionally, paddy fields are known for CH4 emissions and the fields with various crops can generate N2O emissions. The emission-factor method, a widely used and relatively simple way of estimating agricultural carbon emissions, is used to calculate carbon emissions (Sun et al., Citation2022). Relevant studies conducted in China were consulted and all the sources mentioned above were taken into consideration. Due to data limitations, we assumed that the consumption of materials used in cropping systems is equal to that in the agricultural sector. Based on previous studies (Chen et al., Citation2021; Huang et al., Citation2013; Meng et al., Citation2023), the carbon emissions from cropping systems were calculated as follows:
(2)
(2)
(3)
(3)
(4)
(4) where CE represents the total carbon emission, CEC represents the carbon emission from crop fields; CEI represents the carbon emission induced by agricultural inputs; Sp represents the paddy area;
represents the emission factor for the CH4 from paddy; Si represents the area of crop i;
represents the emission factor for the N2O from field of crop i; 25 and 298 are the conversion factors of CH4 and N2O to CO2, respectively; AIj represents the consumption of input j; and EFj represents the emission factor for input j. All the emission factors are listed in .
Table 2. Carbon emission factors of different sources.
In addition, the carbon emission per unit of total area of crops was defined as the carbon emission intensity and calculated as follows:
(5)
(5) where CI indicates the carbon emission intensity, and TS indicates the total area of crops.
3.2.4. Relationship analysis
The Grey Incidence Analysis (GIA) model was used to investigate the correlation between various crops and carbon emissions, contributing to understanding the effect of changes in crop plantation on agricultural carbon emission. GIA was developed based on the Grey System Theory. Through the comparison of the relatively changing characteristics of the factors in time series, the closeness of a relation is estimated based on the similarity level of the size, direction, and speed of their changes (Tao, Citation2013). The method performs well with small samples and has no conventional distribution requirements, as well as can avoid issues of disagreement between quantitative and qualitative conclusions (Liu et al., Citation2017). Therefore, it has been introduced in areas related to agricultural carbon emissions (He et al., Citation2018). The degree of closeness depicts the interaction and mutual influence between carbon emissions and the effects of various crops, and can be calculated as follows:
(6)
(6)
(7)
(7) where Ri represents the coefficient of correlation, ρ represents the distinguishing coefficient whose value is usually 0.5, and x0(k)-xi(k) represents the difference between carbon emission sequence x0 and the crop sequence xi at the kth moment. Ri ranges from 0 to 1, in which a large value indicates a great degree of correlation.
4. Results
4.1. Crop mix changes
4.1.1. Changes of crop-mix type
The distribution of crop-mix types () shows that grain crops predominantly occupy dominant positions, with vegetable and oil crops being the two primary cash crops. Rice was mainly distributed in Southern China, while maize was prevalent in Northeastern and Northern regions. By 2020, maize had gradually expanded to the Northwestern regions such as Shaanxi, Gansu, and Ningxia. Meanwhile, Xinjiang and Tibet were characterized by cotton and highland barley,Footnote1 respectively, with no changes observed in crop-mix type. Statistically, from 2005 to 2020, there was a decreasing trend in the number of single-crop type and an increasing trend in two-crop type. This indicated a shift in crop mix from mainly single-crop type to a combination of multiple crops. In terms of the crop in the first position, rice and maize exhibited the highest frequency. For the second position, vegetables showed a growth trend in the mid to late period. Similarly, in the third position, the frequency of vegetables was also higher than that of other crops during the mid-period. It was suggested that vegetables showed a significant upward trend and later became one of the main crops in some provinces. On the whole, China’s crop mix has changed from mainly grain crops to a combination of grain crops and cash crops.
Figure 3. Provincial crop-mix types in China. (a) and (b) are the distribution of crop-mix types in 2005 and 2020, respectively. (c) depicts the changes in the numbers of crop-mix types. (d) to (f) show the numbers of crops at the first, second, and third positions, respectively. Note: it is produced by authors in ArcGIS 10.4.
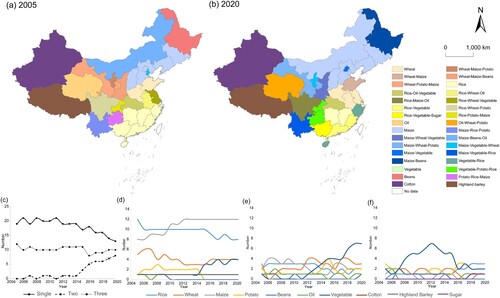
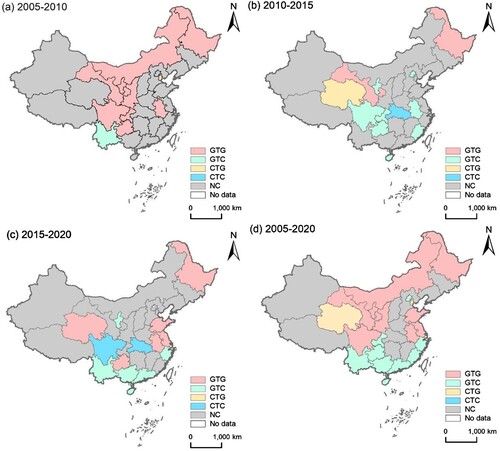
Regarding changes in crop types, most provinces in China experienced changes, with notable spatiotemporal differences (). Between 2005 and 2010, changes were mainly characterized by GTG, mostly distributed in parts of western China and Heilongjiang. From 2010 to 2015, the changes were highly diverse, with many southern provinces being dominated by GTC. From 2015 to 2020, the GTC further moved southward, while CTC was distributed in Hubei and Sichuan. Overall, from 2005 to 2020, changes in crop-mix type exhibited significant regional differences in China, with GTG and GTC being the two primary patterns. GTG was observed in parts of Western China, Heilongjiang–Inner Mongolia, and Shandong–Anhui–Jiangsu, while GTC was prevalent in provinces along the southern boundary.
Figure 4. Changes in crop-mix types in China from 2005 to 2020. Note: it is produced by authors in ArcGIS 10.4.
4.1.2. Changes in the proportion of various crops
displays the trends of various crops using a natural breaks method for classification. In grain crops cultivation, the rice-growing areas were primarily located in the northeastern and central regions, with some Southern provinces showing a significant decreasing trend. The proportion of wheat mainly increased in some eastern and central provinces, while the proportion of maize increased significantly in most provinces, especially in the northeastern and northern regions. In contrast to maize, the proportion of beans exhibited a significant downward trend in most provinces. Among grain crops, maize was the main crop that increased, while beans were the main crop that decreased nationwide. The changes observed in other grain crops exhibited regional characteristics.
Figure 5. Trends of proportions of various crops from 2005 to 2020. Note: it is produced by authors in ArcGIS 10.4.
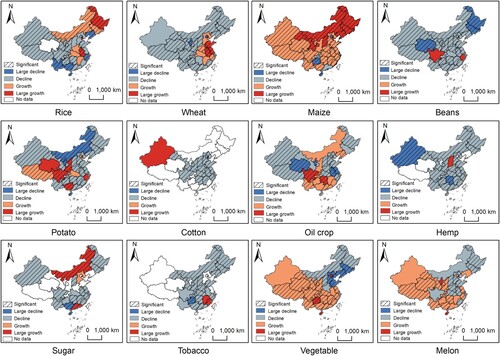
Regarding cash crops, the proportion of cotton has decreased in most regions, except for Xinjiang, which remains an important cotton-producing area. Oil crops showed a notable increasing trend mainly in the southern region. Conversely, hemp, sugar, and tobacco crops generally displayed a downward trend, although some provinces have experienced significant increases. Taking Shaanxi–Gansu–Ningxia–Hubei–Anhui–Jiangsu as a boundary, there are clear regional differences in the trend of vegetable production. Provinces to the east and north of this line experienced a decline, while those to the west and south saw growth. Melons were mainly distributed in western and southern provinces. Among the cash crops, vegetables and melons witnessed the most pronounced growth, while cotton, hemp, and tobacco experienced widespread declines. Overall, there was a clear increase in cash crops in the south and southwest of China.
4.2. Carbon emissions from cropping systems
4.2.1. Estimation of carbon emission intensity
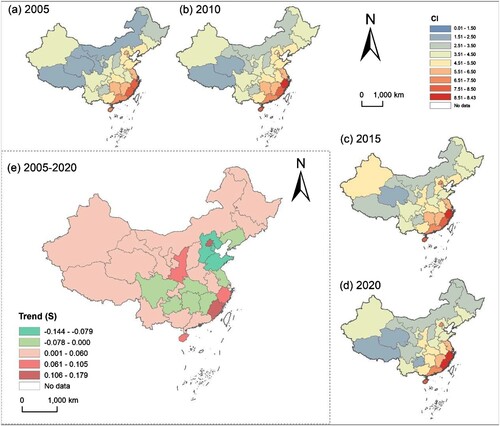
The CIs of the provinces ranged from 1 to 9 (t/ha) and showed obvious differences (). Between 2005 and 2020, the CIs in most provinces initially increased and then decreased. Zhejiang recorded the highest CI with an average value of 9.604 (t/ha), while the mean CIs in Fujian, Hainan, Guangdong, and Shanghai also exceeded 7 (t/ha). Qinghai displayed the lowest CI, with an average of approximately 2 (t/ha). In terms of the trend, the number of provinces with an upward trend was approximately twice that of those with a downward trend. Fujian showed the largest increase, with a slope coefficient of 0.179, while Qinghai, Guangxi, and Shanxi had coefficients below 0.01. Conversely, Tianjin showed the largest decline with a slope coefficient of −0.144. Overall, the majority of provinces in China have depicted an upward trend in CI from 2005 to 2020.
Table 3. Carbon emission intensity of cropping systems in China (t/ha).
4.2.2. Spatiotemporal changes in carbon emission intensity
The CIs generally exhibited a spatial pattern of gradual decrease from southeast to northwest (). Provinces with high CI were mostly located along the southeastern coast, including Zhejiang, Fujian, Guangdong, and Hainan. Provinces with low CI were primarily distributed in the west and northwest, such as Tibet, Qinghai, Gansu, and Inner Mongolia. Regarding the spatial distribution of the CI trends, areas with prominent increases in CI were mainly located along the southeastern coast, as well as in Shaanxi and Beijing. Conversely, areas with decreasing CI were mainly located in some provinces of the central and eastern regions. Among these, Hebei, Tianjin, and Shandong showed the most distinct downward trends. It is worth noting that the area with decreasing CI had a conciderable spatial overlap with the main grain-producing areas.
Figure 6. Spatial pattern of CI from cropping systems in China. (a) to (d) are the CIs in 2005, 2010, 2015, and 2020, respectively. (e) is the trend of CIs from 2005 to 2020. Note: it is produced by authors in ArcGIS 10.4.
4.3. Relationship between crop mix and carbon emissions
4.3.1. Crop-mix type and carbon emission
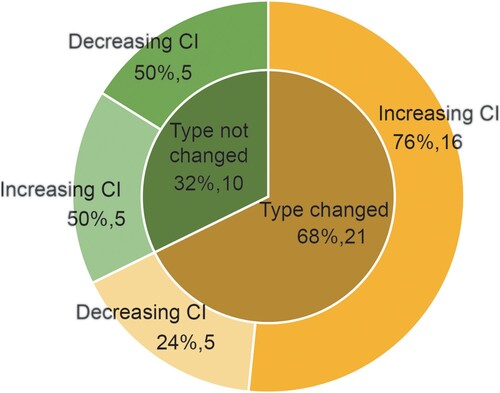
A comparison between the changes in crop-mix types () and the spatial distribution of changes in CI from 2005 to 2020 () revealed a correlation between the areas with changed crop-mix types and the areas with relatively high CI. Statistical analysis of the number of provinces with changes in both crop-mix type and CI () indicated that more than three-quarters of the provinces where the crop-mix type changed also displayed an upward trend in CI. In provinces where the crop-mix type remains unchanged, 50% showed a decrease in CI. These findings suggest a certain correlation between the change in crop-mix type and the trend of CI. Whenever the crop-mix type changed, whether it was GTG or GTC, the cropping system was likely to experience an increase in CI.
Figure 7. Percentage and number of changes in crop mix type and CI. Note: it is produced by authors in Excel 2019.
4.3.2. Correlation between various crops and carbon emission
GIA was conducted to evaluate the correlation between crops and carbon emissions in each province. The top three crops with the highest correlation coefficient were identified as the correlated crops. presents the average correlation coefficient of each crop and the number of correlated provinces. Among all the crops, vegetables showed the highest correlation coefficient of 0.814, followed closely by rice at 0.808. These two crops were also associated with a large number of provinces, with 20 and 14, respectively. Melon, maize, and potato also displayed high correlation coefficients and were related to the CI in many provinces. Other crops had relatively low correlation coefficients and were associated with fewer provinces. Overall, the crops highly correlated with the CI changes were mainly grain crops such as rice, maize, and potatoes, along with cash crops like vegetables and melon.
Table 4. Correlation between crops and carbon emissions in China.
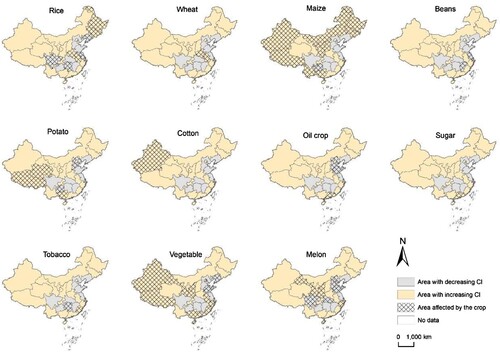
By labelling the correlated crops with the same trend as CI as having a strong effect, the spatial distributions of relationships between various crops and CI were obtained (). Concerning areas affected by different crops, most of the regions affected by rice were main grain-producing provinces. Maize mainly affected the provinces in the north, west, and southwest, most of which had increased CI. Provinces affected by potatoes were relatively scattered. Notably, vegetables had a significant impact on the increase in carbon emissions, particularly contributing to the rise of CI in the southeastern coastal and western provinces.
Figure 8. Spatial pattern of correlations between various crops and CI from 2005 to 2020. Note: it is produced by authors in ArcGIS 10.4.
5. Discussion
5.1. Relationship between crop mix changes and agricultural transition
While previous research has revealed the transition to cash crop production in China based on land area proportions (Kong, Citation2020), our study conducted a detailed analysis of this pattern from the perspective of changes in crop-mix types. The study reveals that the transition from grain crops to cash crops primarily occurred in southern provinces, which is in line with earlier findings indicating the ‘non-grain’ phenomenon, wherein grain crops are replaced by cash crops, was more evident in southern regions (Meng et al., Citation2022; Zhao et al., Citation2017). Furthermore, the research uncovers new insights into the alterations in grain crop varieties in northern regions, which have often been overlooked in previous studies. Hence, our findings will offer additional valuable evidence to comprehend different processes of cropping system transition.
The evolving crop mix has provided a new perspective for understanding cropland use and agricultural transition in China. For one thing, driven by ongoing urbanization and industrialization, cropland use has undergone significant transformations into other land uses, accompanied by changes in explicit forms like quantity and spatial pattern (Long, Citation2020; Long & Qu, Citation2018). The shift in crop mix provides a more detailed view, illustrating that the transition is not only reflected in the relationship between cropland and other land types (Ge et al., Citation2018; Li et al., Citation2021), but also in the internal allocation of cropland. The changes in crop mix suggest a shift in people’s allocation preferences towards cash crops in the cropland use process. For another thing, the spatial heterogeneity of transition trends is expressed through the distribution of crop mix characteristics. As indicated by our results, crop trends varied across regions and the changing pattern of crop-mix types was also characterized by significant spatial aggregation. Additionally, a correlation is observed between the main grain-producing region and these trends. Overall, the structural shift in the cropping system reflects the trend of cropland use and agricultural production within a rapidly developing economic and policy context.
5.2. Understanding the effects of crop mix changes on carbon emission.
This study explored the relationship between crop mix and carbon emissions. Although earlier research has analyzed the contribution of various crops, explicit discussions on correlation coefficients or spatial heterogeneity have been lacking. Our findings indicate that regions with a high proportion of rice tend to have relatively high CI, and that the increase in CI is associated with maize and vegetable production in most provinces. These provincial-level results align with existing national-level studies in China (Chen et al., Citation2021), which have identified vegetables, melons, and maize as contributors to the increased carbon emissions, but our study has provided additional spatial information. Therefore, our research has not only echoed previous findings but also served as an extension.
In addition to the fields with crops, agricultural production materials are increasingly recognized as significant contributors to carbon emissions. The production of crops requires various materials, which can affect their impact on carbon emissions. For one thing, as mentioned above, the demands for production materials of different crops are diverse (Linquist et al., Citation2012), with cash crops generally requiring more energy and emitting more greenhouse gases than grain crops. Consequently, adjustments in cropping systems will affect the carbon emissions caused by materials input. For instance, the growth of crops requiring high input in the cropping system can increase carbon emissions. For another thing, cropping system adjustments are often made to pursue high production efficiency and economic benefits (Du & Han, Citation2020), which is typically accompanied by substantial investment in chemical fertilizers and pesticides to boost crop yield (Jiao et al., Citation2018; West et al., Citation2014). The 10% increase in fertilizer use in China since 2005 aligns with the upward trend of CI in most cases, while the CIs of many provinces decreased along with the policy of reducing fertilizer and pesticides implemented after 2015. Therefore, we suppose that the use of agricultural materials may play a mediating role in the effect of crop mix changes on carbon emissions.
5.3. Policy implications
Agricultural production is closely linked to both food supply and environmental protection. It is crucial for sustainable development to explore the potential dual dividends of crop production to simultaneously secure food supplies and promote environment conservation (Ye et al., Citation2023). Based on the results and discussions presented above, it is required to develop sustainable agricultural policies focusing on land use allocation planning for crop cultivation and optimization of production processes for high-emission crops. Firstly, there is a need to enhance rational crop production layout planning. On one hand, to reduce carbon emissions and preserve soil quality, it is recommended to discourage the expansion of high-emission crops and the occupation of prime cropland. On the other hand, it is essential to consider food demand and scientifically forecast socio-demographic development trends and demands, enabling the planning of production scale and spatial layout of different crops with a multi-objective orientation. Secondly, emphasis should be placed on the potential carbon reduction of the production process. In terms of scale, large-scale production patterns typically lead to efficiency gains, leading to improved input utilization efficiency and reduced carbon emissions. Research has shown that the development of large-scale farms effectively reduces carbon emissions (Staniszewski et al., Citation2023; Yan et al., Citation2015). Land transfer can also facilitate the aggregation of fragmented cropland, enhancing scalability. Thus, measures encouraging land transfer and large-scale production should be strengthened. From a technical and agronomic standpoint, it is essential to advance clean production technologies and employ scientific cropland management practices. Optimizing the use of organic fertilizer, implementing water-controlled cultivation methods in rice production, and exploring better varieties with low carbon emissions are recommended strategies. Developing diversified crop practices, such as maize-soybean intercropping, and conservation agriculture that alleviate soil carbon emissions have also been proven effective measures (O’Dell et al., Citation2020; Pezzuolo et al., Citation2017). Lastly, when implementing crop adjustment and improving agricultural technology, it is essential to consider the potential impacts on the ecosystem and the economic well-being of farmers.
5.4. Limitations and prospects
This study aimed to explain the effect of changes in crop mix and various crops on the carbon emissions from cropping systems. However, several limitations should be considered. Firstly, the absence of material data for different crops makes it difficult to estimate the carbon emissions and determine the contributions of various crops. Owing to limitations in statistical data, our assumption regarding the consumption of production materials might have led to an overestimation of carbon emissions. In addition, this study has mainly focused on analyzing the carbon emission aspect of cropping systems. Future research can consider the carbon sinks in agricultural land and cropping systems, which also play a crucial role in sustainability. By considering cropping systems as both carbon sources and sinks and evaluating the carbon balance comprehensively, future studies can assess the response of carbon emissions to changes in cropping systems in a more integrated way.
6. Conclusions
Carbon emissions and environmental impacts of farming continue to be a global concern. In the context of cropping systems transition, it is significant to identify the characteristics of crop mix and their relationship with carbon emissions for sustainable agricultural development. Using provincial crop production data from China spanning 2005 to 2020, this study introduced a new rule for identifying changes in crop-mix types and explored the spatiotemporal dynamics of crop mix. Then, the correlations between various crops and carbon emissions were evaluated and the spatial distribution was analyzed to explore the topic further. Our results revealed a significant transformation in China’s crop mix, with southern provinces showing a notable shift from grain crops to cash crops. Maize, vegetables, and melons experienced significant increases in proportion, while beans, cotton, and hemp witnessed declines. Besides, CIs from the cropping system have shown upward trends in most provinces, with a spatial pattern of gradual decrease from southeast to northwest. It was observed that adjustments in crop mix were usually accompanied by an increase in CI. Rice, maize, vegetables, and melon were the crops most closely correlated with carbon emission changes. Also, the increasing ratios of maize and vegetables have become important factors in the CI increase in most provinces. These findings suggested that the transformation of cropping systems is a result of changes in the internal distribution of cropland use and this structural transformation is crucial for promoting sustainable agriculture. It is also suggested that the relationship between cropping systems and carbon emissions is influenced by the use of chemical inputs, which plays a crucial connecting role and makes agricultural production technologies a key factor in achieving sustainable agriculture. To mitigate carbon emissions and advance sustainable agricultural development, it is necessary to optimize crop production layout and enhance production approaches, which can be achieved through strategies such as transferring land for scaled farms, use of superior species, and strengthening technologies. The study employed a novel identification rule and provided valuable spatial correlation information. However, limitation in data acquisition represents a drawback. Future studies should undertake comprehensive assessments that comprehensively consider the balancing role of carbon sinks.
GraphicalAbstract1.jpg
Download JPEG Image (116.4 KB)
Disclosure statement
No potential conflict of interest was reported by the author(s).
Additional information
Funding
Notes
1 Due to natural conditions, highland barley mainly grows in Tibet, so it is only shown as the main crop in Tibet but not included in the national level research.
References
- Abram, N. K., Meijaard, E., Wilson, K. A., Davis, J. T., Wells, J. A., Ancrenaz, M., Budiharta, S., Durrant, A., Fakhruzzi, A., Runting, R. K., Gaveau, D., & Mengersen, K. (2017). Oil palm–community conflict mapping in Indonesia: A case for better community liaison in planning for development initiatives. Applied Geography, 78, 33–44. https://doi.org/10.1016/j.apgeog.2016.10.005
- Adler, P. R., Grosso, S. J. D., & Parton, W. J. (2007). Life-cycle assessment of net greenhouse-gas flux for bioenergy cropping systems. Ecological Applications, 17(3), 675–691. https://doi.org/10.1890/05-2018
- Ahrends, A., Hollingsworth, P. M., Ziegler, A. D., Fox, J. M., Chen, H., Su, Y., & Xu, J. (2015). Current trends of rubber plantation expansion may threaten biodiversity and livelihoods. Global Environmental Change, 34, 48–58. https://doi.org/10.1016/j.gloenvcha.2015.06.002
- An, Y., Tan, X., Tan, J., Yu, H., Wang, Z., & Li, W. (2021). Evolution of crop planting structure in traditional agricultural areas and Its influence factors: A case study in human province. Economic Geography, 41, 156–166. https://doi.org/10.15957/j.cnki.jjdl.2021.02.017. In Chinese.
- Carlson, K. M., Curran, L. M., Ratnasari, D., Pittman, A. M., Soares-Filho, B. S., Asner, G. P., Trigg, S. N., Gaveau, D. A., Lawrence, D., & Rodrigues, H. O. (2012). Committed carbon emissions, deforestation, and community land conversion from oil palm plantation expansion in West Kalimantan, Indonesia. Proceedings of the National Academy of Sciences, 109(19), 7559–7564. https://doi.org/10.1073/pnas.1200452109
- Cayambe, J., Heredia-R, M., Torres, E., Puhl, L., Torres, B., Barreto, D., Heredia, B. N., Vaca-Lucero, A., & Diaz-Ambrona, C. G. H. (2023). Evaluation of sustainability in strawberry crops production under greenhouse and open-field systems in the Andes. International Journal of Agricultural Sustainability, 21(1), 2255449. https://doi.org/10.1080/14735903.2023.2255449
- Ceddia, M. G. (2020). The super-rich and cropland expansion via direct investments in agriculture. Nature Sustainability, 3(4), 312–318. https://doi.org/10.1038/s41893-020-0480-2
- Chen, X., Ma, C., Zhou, H., Liu, Y., Huang, X., Wang, M., Cai, Y., Su, D., Muneer, M. A., Guo, M., Chen, X., Zhou, Y., Hou, Y., Cong, W., Guo, J., Ma, W., Zhang, W., Cui, Z., Wu, L., … Zhang, F. (2021). Identifying the main crops and key factors determining the carbon footprint of crop production in China, 2001–2018. Resources, Conservation and Recycling, 172, 105661. https://doi.org/10.1016/j.resconrec.2021.105661
- Cheng, K., Pan, G., Smith, P., Luo, T., Li, L., Zheng, J., Zhang, X., Han, X., & Yan, M. (2011). Carbon footprint of China’s crop production—An estimation using agro-statistics data over 1993–2007. Agriculture, Ecosystems & Environment, 142(3–4), 231–237. https://doi.org/10.1016/j.agee.2011.05.012
- Clay, J. (2011). Freeze the footprint of food. Nature, 475(7356), 287–289. https://doi.org/10.1038/475287a
- Conrad, C., Löw, F., & Lamers, J. P. A. (2017). Mapping and assessing crop diversity in the irrigated Fergana Valley, Uzbekistan. Applied Geography, 86, 102–117. https://doi.org/10.1016/j.apgeog.2017.06.016
- Delpeuch, C., & Leblois, A. (2014). The elusive quest for supply response to cash-crop market reforms in Sub-saharan Africa: The case of cotton. World Development, 64, 521–537. https://doi.org/10.1016/j.worlddev.2014.06.007
- Dong, J., Xiao, X., Chen, B., Torbick, N., Jin, C., Zhang, G., & Biradar, C. (2013). Mapping deciduous rubber plantations through integration of PALSAR and multi-temporal Landsat imagery. Remote Sensing of Environment, 134, 392–402. https://doi.org/10.1016/j.rse.2013.03.014
- Du, Z., & Han, L. (2020). The impact of production-side changes in grain supply on China’s food Security. Chinese Rural Economy, 4, 2–14. In Chinese.
- Fuentes-Ponce, M. H., Gutiérrez-Díaz, J., Flores-Macías, A., González-Ortega, E., Mendoza, A. P., Sánchez, L. M. R., Novotny, I., & Espíndola, I. P. M. (2022). Direct and indirect greenhouse gas emissions under conventional, organic, and conservation agriculture. Agriculture, Ecosystems & Environment, 340, 108148. https://doi.org/10.1016/j.agee.2022.108148
- Garnett, T., Appleby, M. C., Balmford, A., Bateman, I. J., Benton, T. G., Bloomer, P., Burlingame, B., Dawkins, M., Dolan, L., Fraser, D., Herrero, M., Hoffmann, I., Smith, P., Thornton, P. K., Toulmin, C., Vermeulen, S. J., & Godfray, H. C. J. (2013). Sustainable intensification in agriculture: Premises and policies. Science, 341(6141), 33–34. https://doi.org/10.1126/science.1234485
- Ge, D., Long, H., & Yang, R. (2018). The pattern and mechanism of farmland transition in China from the perspective of per capita farmland area. Resources Science, 40, 273–283. https://doi.org/10.18402/resci.2018.02.05. In Chinese.
- Gollnow, F., Hissa, L. d. B. V., Rufin, P., & Lakes, T. (2018). Property-level direct and indirect deforestation for soybean production in the Amazon region of Mato Grosso, Brazil. Land Use Policy, 78, 377–385. https://doi.org/10.1016/j.landusepol.2018.07.010
- He, Y., Chen, R., Wu, H., Xu, J., & Song, Y. (2018). Spatial dynamics of agricultural carbon emissions in China and the related driving factors. Chinese Journal of Eco-Agriculture, 26(9), 1269–1282. https://doi.org/10.13930/j.cnki.cjea.171097
- Hua, X., Kono, Y., & Zhang, L. (2021). Excavating agrarian transformation under ‘secure’ crop booms: Insights from the China-Myanmar borderland. The Journal of Peasant Studies, 1–30. https://doi.org/10.1080/03066150.2021.1926993
- Huang, J., Chen, Y., Sui, P., & Gao, W. (2013). Estimation of net greenhouse gas balance using crop- and soil-based approaches: Two case studies. Science of The Total Environment, 456-457, 299–306. https://doi.org/10.1016/j.scitotenv.2013.03.035
- Huang, X., Chen, C., Qian, H., Chen, M., Deng, A., Zhang, J., & Zhang, W. (2017). Quantification for carbon footprint of agricultural inputs of grains cultivation in China since 1978. Journal of Cleaner Production, 142, 1629–1637. https://doi.org/10.1016/j.jclepro.2016.11.131
- Hunter, M. C., Smith, R. G., Schipanski, M. E., Atwood, L. W., & Mortensen, D. A. (2017). Agriculture in 2050: Recalibrating targets for sustainable intensification. BioScience, 67(4), 386–391. https://doi.org/10.1093/biosci/bix010
- Isbell, C., Tobin, D., & Reynolds, T. (2021). Motivations for maintaining crop diversity: Evidence from Vermont’s seed systems. Ecological Economics, 189, 107138. https://doi.org/10.1016/j.ecolecon.2021.107138
- Jianyi, L., Yuanchao, H., Shenghui, C., Jiefeng, K., & Lilai, X. (2015). Carbon footprints of food production in China (1979–2009). Journal of Cleaner Production, 90, 97–103. https://doi.org/10.1016/j.jclepro.2014.11.072
- Jiao, X., He, G., Cui, Z., Shen, J., & Zhang, F. (2018). Agri-environment policy for grain production in China: Toward sustainable intensification. China Agricultural Economic Review, 10(1), 78–92. https://doi.org/10.1108/CAER-10-2017-0201
- Jin, T. (2019). The adjustment of China’s grain cropping structure and its effect on the consumption of water and land resources. Journal of Natural Resources, 34(1), 14–25. In Chinese. https://doi.org/10.31497/zrzyxb.20190102
- Johnson, J. M. F., Franzluebbers, A. J., Weyers, S. L., & Reicosky, D. C. (2007). Agricultural opportunities to mitigate greenhouse gas emissions. Environmental Pollution, 150(1), 107–124. https://doi.org/10.1016/j.envpol.2007.06.030
- Knudsen, M. T., Meyer-Aurich, A., Olesen, J. E., Chirinda, N., & Hermansen, J. E. (2014). Carbon footprints of crops from organic and conventional arable crop rotations – using a life cycle assessment approach. Journal of Cleaner Production, 64, 609–618. https://doi.org/10.1016/j.jclepro.2013.07.009
- Kong, X. (2020). Problems, causes and countermeasures of “non-grain” of cultivated land. China Land, 11, 17–19. https://doi.org/10.13816/j.cnki.ISSN1002-9729.2020.11.05. In Chinese.
- Kumar, P., & Joshi, P. K. (2016). Food demand and supply projections to 2030: India. In F. Brouwer & P. K. Joshi (Eds.), International trade and food security: The future of Indian agriculture (Part 2, Chapter 4, pp. 29–63). CABI.
- Li, B., Zhang, J., & Li, H. (2011). Research on spatial-temporal characteristics and affecting factors decomposition of agricultural carbon emission in China. China Population, Resources and Environment, 21, 80–86. In Chinese.
- Li, J., Xing, J., Ding, R., Shi, W., Shi, X., & Wang, X. (2023). Systematic evaluation of nitrogen application in the production of multiple crops and its environmental impacts in Fujian province, China. Agriculture, 13(3), 694. https://doi.org/10.3390/agriculture13030694
- Li, L., Wang, L., & Qi, Z. (2021). The spatiotemporal variation of farmland use transition and its critical influential factors in coordinated urban-rural regions: A case of Chongqing in western China. Sustainable Cities and Society, 70, 102921. https://doi.org/10.1016/j.scs.2021.102921
- Lienhard, P., Lestrelin, G., Phanthanivong, I., Kiewvongphachan, X., Leudphanane, B., Lairez, J., Quoc, H. T., & Castella, J.-C. (2020). Opportunities and constraints for adoption of maize-legume mixed cropping systems in Laos. International Journal of Agricultural Sustainability, 18(5), 427–443. https://doi.org/10.1080/14735903.2020.1792680
- Linquist, B., van Groenigen, K. J., Adviento-Borbe, M. A., Pittelkow, C., & van Kessel, C. (2012). An agronomic assessment of greenhouse gas emissions from major cereal crops. Global Change Biology, 18(1), 194–209. https://doi.org/10.1111/j.1365-2486.2011.02502.x
- Liu, S., Yang, Y., & Forrest, J. (2017). Grey incidence analysis models. In S. Liu, Y. Yang, & J. Forrest (Eds.), Grey data analysis: Methods, models and applications (pp. 67–103). Springer Singapore.
- Liu, W., Zhang, G., Wang, X., Lu, F., & Ouyang, Z. (2018b). Carbon footprint of main crop production in China: Magnitude, spatial-temporal pattern and attribution. Science of The Total Environment, 645, 1296–1308. https://doi.org/10.1016/j.scitotenv.2018.07.104
- Liu, Z., Yang, P., Wu, W., & You, L. (2018a). Spatiotemporal changes of cropping structure in China during 1980–2011. Journal of Geographical Sciences, 28(11), 1659–1671. https://doi.org/10.1007/s11442-018-1535-4
- Long, H. (2020). Farmland use transition in China. In H. Long (Ed.), Land use transitions and rural restructuring in China (pp. 31–160). Springer.
- Long, H., & Qu, Y. (2018). Land use transitions and land management: A mutual feedback perspective. Land Use Policy, 74, 111–120. https://doi.org/10.1016/j.landusepol.2017.03.021
- Lu, X., Kuang, B., Li, J., Han, J., & Zhang, Z. (2018). Dynamic evolution of regional discrepancies in carbon emissions from agricultural land utilization: Evidence from Chinese provincial data. Sustainability, 10, 1–13. https://doi.org/10.3390/su10020001
- Magazzino, C., Cerulli, G., Haouas, I., Unuofin, J. O., & Sarkodie, S. A. (2023b). The drivers of GHG emissions: A novel approach to estimate emissions using nonparametric analysis. Gondwana Research, 127, 4–21. https://doi.org/10.1016/j.gr.2023.10.004
- Magazzino, C., Cerulli, G., Shahzad, U., & Khan, S. (2023a). The nexus between agricultural land use, urbanization, and greenhouse gas emissions: Novel implications from different stages of income levels. Atmospheric Pollution Research, 14(9), 101846. https://doi.org/10.1016/j.apr.2023.101846
- Meng, F., Tan, Y., & Chen, H. (2023). Decoupling relationship between greenhouse gas emissions from cropland utilization and crop yield in China: Implications for green agricultural development. Environmental Science and Pollution Research, 30(43), 97160–97177. https://doi.org/10.1007/s11356-023-29117-0
- Meng, F., Tan, Y., Chen, H., & Xiong, W. (2022). Spatial-temporal evolution patterns and influencing factors of “non-grain” utilization of cultivated land in China. China Land Science, 36(01), 97–106. In Chinese.
- Min, J., & Hu, H. (2012). Calculation of greenhouse gases emission from agricultural production in China. China Population, Resources and Environment, 22, 21–27. In Chinese.
- National Data. (2022). National Bureau of Statistics of China. https://data.stats.gov.cn/easyquery.htm?cn=C01. Accessed on March 10, 2022.
- O’Dell, D., Eash, N. S., Hicks, B. B., Oetting, J. N., Sauer, T. J., Lambert, D. M., Thierfelder, C., Muoni, T., Logan, J., Zahn, J. A., & Goddard, J. J. (2020). Conservation agriculture as a climate change mitigation strategy in Zimbabwe. International Journal of Agricultural Sustainability, 18(3), 250–265. https://doi.org/10.1080/14735903.2020.1750254
- Pathak, H., Jain, N., Bhatia, A., Patel, J., & Aggarwal, P. K. (2010). Carbon footprints of Indian food items. Agriculture, Ecosystems & Environment, 139(1–2), 66–73. https://doi.org/10.1016/j.agee.2010.07.002
- Pezzuolo, A., Dumont, B., Sartori, L., Marinello, F., De Antoni Migliorati, M., & Basso, B. (2017). Evaluating the impact of soil conservation measures on soil organic carbon at the farm scale. Computers and Electronics in Agriculture, 135, 175–182. https://doi.org/10.1016/j.compag.2017.02.004
- Pretty, J., & Bharucha, Z. P. (2014). Sustainable intensification in agricultural systems[J]. Annals of botany, 114(8), 1571–1596. https://doi.org/10.1093/aob/mcu205
- Robertson, G. P., Paul Eldor, A., & Harwood Richard, R. (2000). Greenhouse gases in intensive agriculture: Contributions of individual gases to the radiative forcing of the atmosphere. Science, 289(5486), 1922–1925. https://doi.org/10.1126/science.289.5486.1922
- Rubhara, T. T., Mudhara, M., Oduniyi, O. S., & Antwi, M. A. (2020). Impacts of cash crop production on household food security for smallholder farmers: A case of Shamva district, Zimbabwe. Agriculture, 10(5), 188. https://doi.org/10.3390/agriculture10050188
- Shackelford, G. E., Kelsey, R., & Dicks, L. V. (2019). Effects of cover crops on multiple ecosystem services: Ten meta-analyses of data from arable farmland in California and the Mediterranean. Land Use Policy, 88, 104204. https://doi.org/10.1016/j.landusepol.2019.104204
- Skiba, U., Hergoualc’h, K., Drewer, J., Meijide, A., & Knohl, A. (2020). Oil palm plantations are large sources of nitrous oxide, but where are the data to quantify the impact on global warming? Current Opinion in Environmental Sustainability, 47, 81–88. https://doi.org/10.1016/j.cosust.2020.08.019
- Song, X., Wang, X., Li, X., Zhang, W., & Scheffran, J. (2021). Policy-oriented versus market-induced: Factors influencing crop diversity across China. Ecological Economics, 190, 107184. https://doi.org/10.1016/j.ecolecon.2021.107184
- Staniszewski, J., Guth, M., & Smędzik-Ambroży, K. (2023). Structural conditions of the sustainable intensification of agriculture in the regions of the European Union. Journal of Cleaner Production, 389, 136109. https://doi.org/10.1016/j.jclepro.2023.136109
- Su, S., Wan, C., Li, J., Jin, X., Pi, J., Zhang, Q., & Weng, M. (2017). Economic benefit and ecological cost of enlarging tea cultivation in subtropical China: Characterizing the trade-off for policy implications. Land Use Policy, 66, 183–195. https://doi.org/10.1016/j.landusepol.2017.04.044
- Su, Y., Li, C., Wang, K., Deng, J., Shahtahmassebi, A. R., Zhang, L., Ao, W., Guan, T., Pan, Y., & Gan, M. (2019). Quantifying the spatiotemporal dynamics and multi-aspect performance of non-grain production during 2000–2015 at a fine scale. Ecological Indicators, 101, 410–419. https://doi.org/10.1016/j.ecolind.2019.01.026
- Sun, X., Pan, X., Jin, C., Li, Y., Xu, Q., Zhang, D., & Li, H. (2022). Life cycle assessment-based carbon footprint accounting model and analysis for integrated energy stations in China. International Journal of Environmental Research and Public Health, 19(24), 16451. https://doi.org/10.3390/ijerph192416451
- Tang, K., Kragt, M. E., Hailu, A., & Ma, C. (2016). Carbon farming economics: What have we learned? Journal of Environmental Management, 172, 49–57. https://doi.org/10.1016/j.jenvman.2016.02.008
- Tao, J. (2013). Hysteresis quantitative analysis of urbanization based on gray correlation degree model. Economic Geography, 33, 68–72. https://doi.org/10.15957/j.cnki.jjdl.2013.12.017. In Chinese.
- Tilman, D., Cassman, K. G., Matson, P. A., Naylor, R., & Polasky, S. (2002). Agricultural sustainability and intensive production practices. Nature, 418(6898), 671–677. https://doi.org/10.1038/nature01014
- Tubiello, F. N., Salvatore, M., Rossi, S., Ferrara, A., Fitton, N., & Smith, P. (2013). The FAOSTAT database of greenhouse gas emissions from agriculture. Environmental Research Letters, 8(1), 015009. https://doi.org/10.1088/1748-9326/8/1/015009
- Vongvisouk, T., Mertz, O., Thongmanivong, S., Heinimann, A., & Phanvilay, K. (2014). Shifting cultivation stability and change: Contrasting pathways of land use and livelihood change in Laos. Applied Geography, 46, 1–10. https://doi.org/10.1016/j.apgeog.2013.10.006
- West, P. C., Gerber, J. S., Engstrom, P. M., Mueller, N. D., Brauman, K. A., Carlson, K. M., Cassidy, E. S., Johnston, M., MacDonald, G. K., Ray, D. K., & Siebert, S. (2014). Leverage points for improving global food security and the environment. Science, 345(6194), 325–328. https://doi.org/10.1126/science.1246067
- West, T. O., & Marland, G. (2002). A synthesis of carbon sequestration, carbon emissions, and net carbon flux in agriculture: Comparing tillage practices in the United States. Agriculture, Ecosystems & Environment, 91(1–3), 217–232. https://doi.org/10.1016/S0167-8809(01)00233-X
- Wilken, F., Wagner, P. D., Narasimhan, B., & Fiener, P. (2017). Spatio-temporal patterns of land use and cropping frequency in a tropical catchment of South India. Applied Geography, 89, 124–132. https://doi.org/10.1016/j.apgeog.2017.10.011
- Wu, G., Liu, J., & Yang, L. (2021). Dynamic evolution of China’s agricultural carbon emission intensity and carbon offset potential. Chinese Population Resources and Environment, 31(10), 69–78. In Chinese.
- Xiao, R., Su, S., Mai, G., Zhang, Z., & Yang, C. (2015). Quantifying determinants of cash crop expansion and their relative effects using logistic regression modeling and variance partitioning. International Journal of Applied Earth Observation and Geoinformation, 34, 258–263. https://doi.org/10.1016/j.jag.2014.08.015
- Xu, H., Ma, B., & Gao, Q. (2021). Assessing the environmental efficiency of grain production and their spatial effects: Case study of major grain production areas in China. Frontiers in Environmental Science, 9. https://doi.org/10.3389/fenvs.2021.774343
- Xu, X., Zhang, B., Liu, Y., Xue, Y., & Di, B. (2013). Carbon footprints of rice production in five typical rice districts in China. Acta Ecologica Sinica, 33(4), 227–232. https://doi.org/10.1016/j.chnaes.2013.05.010
- Yan, M., Cheng, K., Luo, T., Yan, Y., Pan, G., & Rees, R. M. (2015). Carbon footprint of grain crop production in China – based on farm survey data. Journal of Cleaner Production, 104, 130–138. https://doi.org/10.1016/j.jclepro.2015.05.058
- Yan, X., Cai, Z., Ohara, T., & Akimoto, H. (2003). Methane emission from rice fields in mainland China: Amount and seasonal and spatial distribution. Journal of Geophysical Research: Atmospheres, 108. https://doi.org/10.1029/2002JD003182
- Yang, X., Gao, W., Zhang, M., Chen, Y., & Sui, P. (2014). Reducing agricultural carbon footprint through diversified crop rotation systems in the North China Plain. Journal of Cleaner Production, 76, 131–139. https://doi.org/10.1016/j.jclepro.2014.03.063
- Ye, D., Zhen, S., Wang, W., & Liu, Y. (2023). Spatial double dividend from China’s main grain-producing areas policy: Total factor productivity and the net carbon effect. Humanities and Social Sciences Communications, 10(1), 459. https://doi.org/10.1057/s41599-023-01962-x
- Ye, W., Wang, C., Zhao, C., & Zheng, X. (2021). Spatial and temporal evolution of carbon footprint of tropical farmland ecosystem in Hainan Island in recent 20 years. Chinese Journal of Agricultural Resources and Regional Planning, 42(10), 114–126. In Chinese.
- Zhang, D., Shen, J., Zhang, F., Li, Y., & Zhang, W. (2017). Carbon footprint of grain production in China. Scientific Reports, 7(1), 4126. https://doi.org/10.1038/s41598-017-04182-x
- Zhao, X., Zheng, Y., Huang, X., Kwan, M.-P., & Zhao, Y. (2017). The effect of urbanization and farmland transfer on the spatial patterns of Non-grain farmland in China. Sustainability, 9(8), 1438. doi:10.3390/su9081438