
Abstract
Through the Sediment, Ice, & Learning on the Tanana (SILT) project, a team of university scientists engaged two middle school student groups in testing innovative environmental research technologies to measure sediment flowing underneath river ice. The culturally responsive, place-based pilot program tests these technologies as a strategy to increase students’ science interest and science self-efficacy. Over a series of three workshops, 39 students built and deployed low-cost turbidity sensors to measure sediment flowing underneath river ice and designed model payload attachment systems to attach the sensors to drones for measuring sediment fluxes during spring river ice breakup. Students’ changes in science interest and self-efficacy were measured using both a true pre- and post-program survey and a retrospective pre-program survey.
Graphical Abstract
Engaging students in real, publishable scientific research is a promising strategy for increasing their engagement in STEM learning. There are clear differences in learning outcomes for youth who participate in meaningful, hands-on science research versus textbook reading and cookbook labs (Alsultan et al. Citation2021). When scientific research is also meaningful and relevant to their school, family, or community, the impact of the experience on youth is amplified (Berland et al. Citation2016). Through the Sediment, Ice, & Learning on the Tanana (SILT) project, a group of university scientists provided one such connected science learning experience for local youth. We created a partnership between a rural middle school classroom, a homeschool program, and university scientists to build and test cutting-edge environmental research technologies with students as a strategy for increasing their science interest and science self-efficacy, two measures of engagement in STEM learning.
Science interest (the enthusiasm students feel toward science) and science self-efficacy (students’ beliefs in their own abilities to do science-related activities (Phillips et al. Citation2018)) are two positive indicators of whether students both identify with science and pursue science as a career. When students conduct citizen science research in their communities on topics relevant to their everyday lives, their science interest and self-efficacy increase (Clement et al. Citation2023). Through the SILT project, we examined whether involving students in research based in their communities and working with emerging research technologies would have similar effects on youths’ science interest and self-efficacy found in previous citizen science research (Clement et al. Citation2023).
Sediment, Ice, & Learning on the Tanana (SILT)
The SILT project examines how sediment is transported in the Tanana River, a major tributary of the Yukon River in Interior Alaska. Sediment has immense power to shape daily life in boreal rivers and proximal communities (e.g., through erosion and deposition, availability of drinking water, ability for barges to deliver supplies, or whether fishing is possible in the same location every year). Despite sediment being so important to daily life in Interior Alaska, we know very little about it. The amount of sediment flowing in rivers is typically measured during the open-water seasons of summer and fall; little is known about how much sediment is flowing in the water underneath winter ice and during spring break-up because it is so difficult and cost-prohibitive to measure. Several scientists on our team developed a low-cost turbidity sensor with promising potential to measure sediment flow during the majority of the year when northern rivers are covered in ice (Langhorst et al. Citation2023). The SILT project sought to test the sensor’s (1) abilities to measure sediment under river ice and (2) use as a tool to engage local youth in hands-on research in their own backyards.
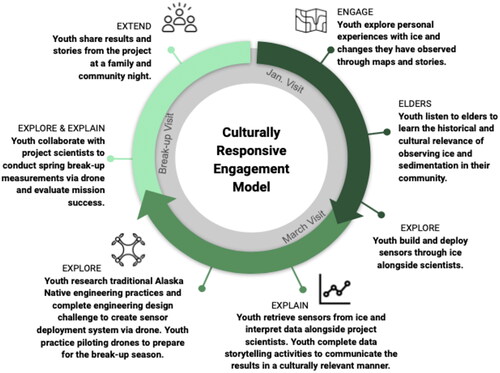
During winter and spring 2023, two middle-school-age youth groups (ages 11–14) from communities located along the Tanana River participated in SILT: a homeschool program based in the city of Fairbanks and a classroom in the smaller rural community of Nenana, located downriver. The homeschool program serves approximately 1,540 students, including 28% from groups underrepresented in STEM. Nine percent of the students are Alaska Native. The school in Nenana serves 163 students, 71% of whom are from groups underrepresented in STEM and 60% of whom are Alaska Native. In total, 39 students participated in the project. We aimed to connect youth across these urban and rural communities, cultural backgrounds, in-school and homeschool environments, and link science research across school, university, and community settings. The educational framework for the SILT project () was adapted from a culturally responsive engagement model used in other youth-focused community and citizen science projects based in Alaska (Spellman et al. Citation2018).
Figure 1. Sediment, Ice and Learning on the Tanana (SILT) educational model.
The workshop series
We developed a three-part workshop series centered on immersing students in novel technologies for measuring sediment, which involved building and deploying low-cost turbidity sensors underneath the river’s ice in midwinter and using drones during ice breakup in the spring to make measurements in surface waters when conditions are still too hazardous for boating (). These sensors, developed by the scientists on our team, are relatively inexpensive and easy to build, and employ open-source programming, making them a uniquely accessible and accurate sediment measurement tool (Langhorst et al. Citation2023). Use with students was one of the test cases for these sensors. At the same time, we aimed to connect in-classroom for the students to explore two innovative methods to measure sediment fluxes in the Tanana River during winter and spring. The workshops, described briefly below, were designed to align with Next Generation Science Standards (NGSS) as well as Alaska Standards for Culturally Responsive Schools (). Our goal was to increase students’ science interest and self-efficacy through participation in the project, and we designed both true pre- and post-program surveys and a retrospective pre-program survey to measure these learning outcomes.
Figure 2. SILT youth workshop series design. Workshops were held in January, March, and April 2023.
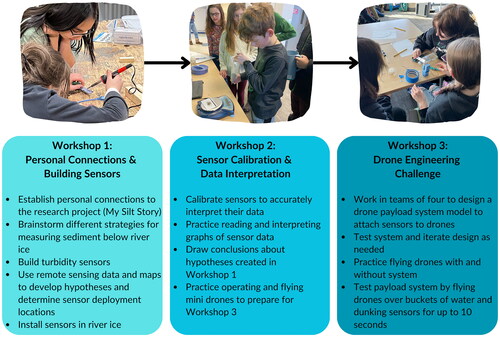
Table 1. The workshop series aligned with standards from the Next Generation Science Standards and the Alaska Standards for Culturally Responsive Schools.
Workshop 1
We started learning by drawing personal connections between the students’ lives and river sediment through an activity called “My Silt Story.” This activity asked students to think of a story from their life that is related to the science topic of the project—in this case, river sediment. After sharing in small groups, students looked for themes among the stories across the group to identify some of the values and importance river sediment had to them and their communities.
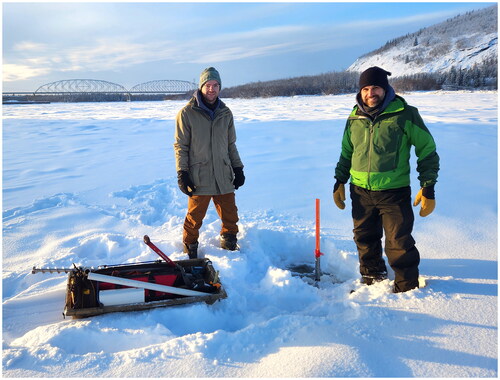
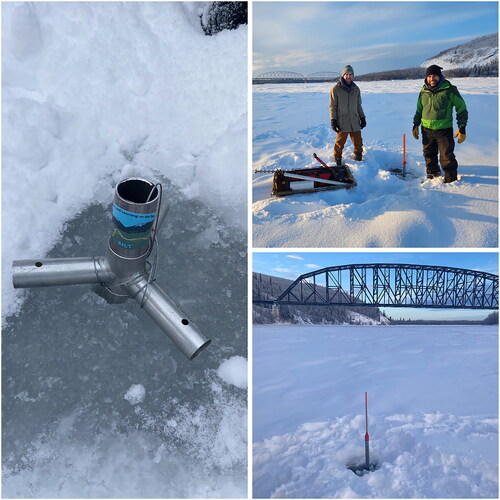
Students then used satellite imagery from Google Earth to examine our two sites along the Tanana River and develop hypotheses about where sediment loads might be greatest. We introduced the central problem our research was addressing: How do you measure sediments under the ice over time? It has been really hard for scientists in Alaska to figure out how to do this well! The students came up with their own ideas and solutions to this problem (). They were introduced to the sensors that had been developed by our scientists; students worked to build their own replicates of these sensors by soldering the components together (). Based on their hypotheses about where sediment loads would be the highest and factoring in safety concerns and feasibility (e.g., open water holes, time required to walk to each spot, etc.), scientists and the students deployed the sensors in Fairbanks and Nenana along the Tanana River (). Before deploying the sensors, the scientists demonstrated how to test the ice to ensure it was thick enough to support the group. Students took turns drilling three holes in the ice to test the thickness at each deployment location. One drill hole at each site was then used to install the sensor in its metal housing. The metal tube froze into the small hole, and the sensors were then left to collect data for approximately one month.
Figure 3. Before constructing turbidity sensors, students recorded their own ideas about how to observe and measure sediment underneath river ice. Top left: text reads “Cut holes in ice, take samples of water and silt mix in different spots, find the ratio of water to silt by filtering out water and silt, compare other spots.” Top right: an image of a drone lowering a tool into the water. Bottom left: a sensor sending signals into the water and collecting data. Bottom right: text reads “Radio connection, send signals, Timed released container, take in silt, take back to study.”
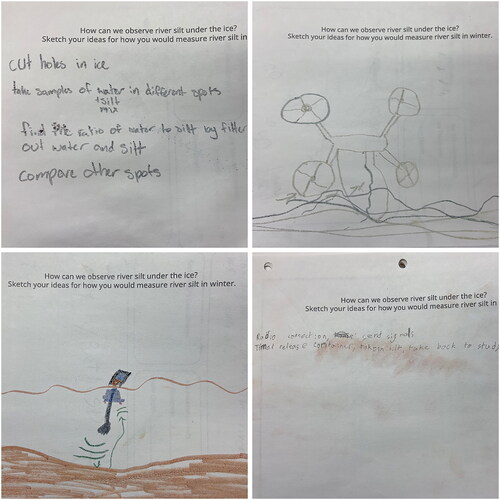
Figure 4. SILT scientist T. Langhorst showcases a version of the assembled turbidity sensor.
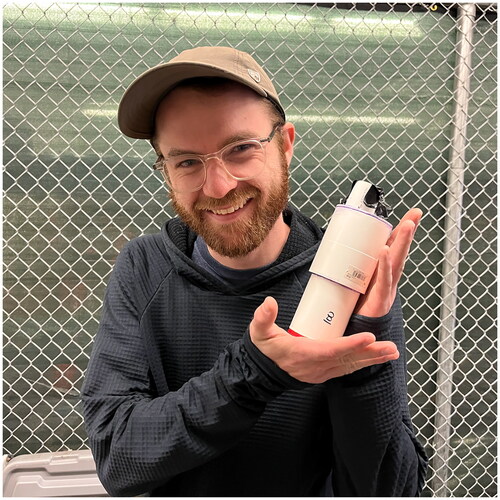
Figure 5. The turbidity sensors were housed in metal pipes (left) and fitted with bright orange stakes for visibility and safety on the Tanana River (top and bottom right).
Workshop 2
Before Workshop 2, SILT scientists retrieved the sensors from both locations to download and clean the data (see a video of the sensor extraction process here). Students began the workshop by learning about the importance of calibrating the sensors so they can interpret their data. They practiced calibrating the sensors by first mixing different concentrations of sediment in pitchers of water and then testing their sensors in each pitcher. Once the calibrated sensor data were ready to view, the students collaboratively worked to interpret the data with project scientists. They revisited the hypotheses they had generated in the first workshop to determine whether their findings supported their hypotheses.
Workshop 3
Our final workshop in the series focused on measuring sediment fluxes during spring breakup. Spring breakup conditions make sediment fluxes difficult to measure because the melting ice makes freezing sensors in the ice impossible, and boat travel is too dangerous due to large ice chunks floating downriver at unpredictable intervals. To skirt these challenges, our team wanted to use drones to dip the turbidity sensors into the river. However, we did not have a specific design in mind, and the students were issued an engineering design challenge to use a model system to figure out a way to attach a turbidity sensor to a drone that could actually be used by our scientists ().
Figure 6. Students drew their ideas for a payload system (top left) and used a variety of materials (top right) to construct and iterate their designs (bottom left and right).
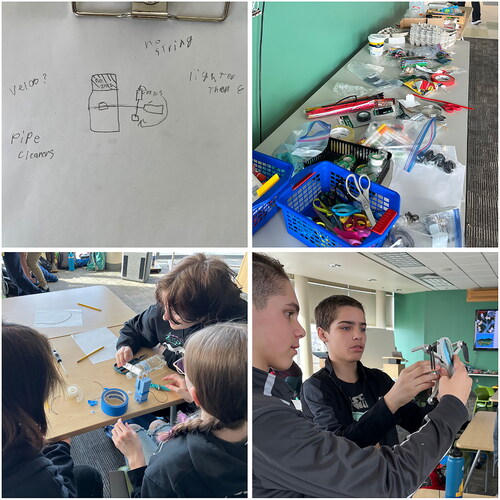
The students used DJI Mini 2 drones and 3D-printed scale models of the sensors. We provided students with an array of materials, such as fishing line, pipe cleaners, various kinds of tape, hose clamps, Velcro, recycled materials, and more. In small groups of four, students devised strategies for attaching the sensor to the drone. Each group made a prototype, tested its model outside with one of the project scientists, and revised the design based on feedback from group members and from the scientist. They also developed a “sales pitch” to highlight the features, design choices, and advantages of their prototype. At the end of the day, each group took turns demonstrating their final model.
Science interest and self-efficacy data collection and analysis
To understand whether the SILT project increased students’ science interest and science self-efficacy, we administered pre- and post-program surveys, as well as a retrospective pre-survey at the end of the program. The survey protocols were approved by the University of Alaska Fairbanks Institutional Review Board (#1961854-2), and youth and parental consent were obtained for all participants. We measured the two constructs using five-item Likert scales created by the Developing, Validating, and Implementing Situated Evaluation Instruments (DEVISE) project at the Cornell Lab of Ornithology. A total of 23 students from the homeschool program and 16 students from the middle school class participated in the three-part workshop series. We collected 31 true pre-program surveys at the start of the first workshop and 24 pre-post retrospective surveys at the end of the final workshop. We successfully matched 21 of the pre-post retrospective surveys with true pre-program surveys.
We conducted pairwise comparisons to test the change in students’ science interest and science self-efficacy from the beginning of the workshop series (both the true pre-program survey scores and the retrospective pre-program survey scores) to the end of the series (). The differences between the true pre-program survey and the post-program survey were not significant for either science interest (mean difference = 0.14, p = 0.41) or science self-efficacy (mean difference = 0.22, p = 0.18); however, the changes between the retrospective pre-program survey and the post-program survey were significant for both science interest (mean difference = 0.49, p < 0.001) and science self-efficacy (mean difference = 0.44, p < 0.001). The aggregate science interest and science self-efficacy scores, as well as the survey questions, are available as Supplementary Material.
Figure 7. Students’ science interest and science self-efficacy scores measured in a pre-program survey, a retrospective pre-program survey (administered after the last workshop), and a post-program survey.
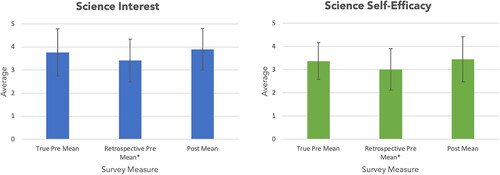
Previous research has found that both true pre-post surveys and retrospective pre-surveys are prone to different forms of bias (Geldhof et al. Citation2018). We sought to reduce bias issues by administering both forms of surveys to compare the differences. On average, students gave themselves higher scores on the true pre-program survey compared to the retrospective pre-program survey. This phenomenon may be an example of one of several types of known survey research issues, including response-shift bias (respondents reporting what they believe survey administrators want to hear), or respondents simply misremembering events (Geldhof et al. Citation2018). The true values of the students’ science interest and science self-efficacy before participating in the SILT project are likely somewhere in between their true and retrospective pre-program survey scores.
We saw a notable difference in the homeschool group’s survey scores compared to those of the middle school group; specifically, the homeschool students scored themselves higher on most or all survey items compared to the middle school students. We attribute this difference in part to how students were recruited to join the SILT project: the homeschool students signed up for the project on a first-come, first-served basis, while the students in the middle school classroom were signed up to participate by their teacher.
As science interest and science self-efficacy are used as two positive indicators for science identity development, we concluded the survey with several open-ended prompts, including Complete the sentence: I felt like a scientist during the SILT project when… followed by Is there any other time you felt like a scientist during the project? Just over half (53%, n = 18) of the survey respondents completed the first prompt (Complete the sentence…), and 10 students also answered the follow-up question (Is there any other time…). We coded their responses using Carlone and Johnson’s (Citation2007) components of science identity to determine which aspects of the program were most salient in promoting students’ science identity growth (). Responses included answers such as “I made a sensor” and “I saw the data from the first workshop.”
Table 2. Aspects of the SILT workshop series that promoted students’ science identities.
The performance component of science identity was by far the most salient for students in this project. This suggests that our goal of building science tools and practicing with them was successful in supporting the students’ science identity work, which in turn can increase their science interest and self-efficacy.
Next steps
The SILT workshop series with rural and homeschool students was a successful test case for engaging youth in local science research using emerging technologies. Our team of scientists identified several areas for improvement in future iterations of the SILT project, including (1) integrating additional culturally responsive teaching and learning strategies into our program design and (2) providing further opportunities for students to test their model design ideas and receive feedback from scientists in real time.
A key component of our educational framework—and one of our central goals in designing the SILT workshops—was to integrate culturally responsive teaching practices from the Alaska Standards for Culturally Responsive Schools to make the project content and goals more relevant and accessible to all participating students. We successfully incorporated several well-documented culturally responsive teaching practices, including grounding the project in students’ home communities and establishing personal connections between the students and the SILT project’s aims. While these teaching practices framed the beginning of the project well, we fell short of our goal to continue using culturally responsive teaching strategies throughout the entire workshop series. In the future we plan to use additional teaching and learning practices that have been shown to be effective for Indigenous students, including intergenerational learning with Elders and storytelling (Tzou et al. Citation2020). Similarly, we believe the SILT project will be even more powerful with more intentional collaboration with our partner teachers and local community members.
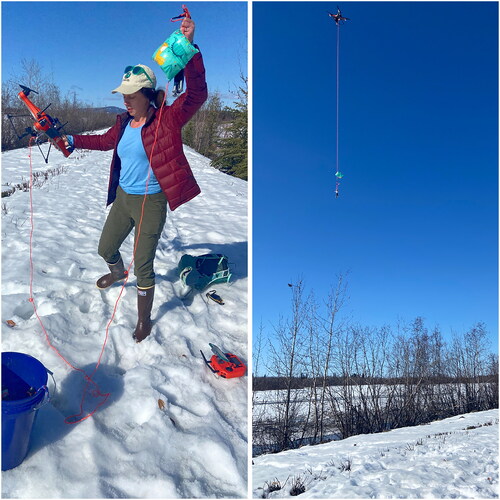
Students’ interest in science and their feelings about their abilities to do science research were strengthened after creating and deploying cutting-edge research technology during the SILT project, as demonstrated in their post-program surveys and SILT scientists’ observations of the project in action. Providing autonomy with science tools has been shown to be an effective strategy to increase students’ positive engagement with science practices (Jones et al. Citation2021). We saw this phenomenon during the third workshop when we emphasized to students that we would be testing ideas from their designs during our first deployment of drones over the Tanana River during spring breakup. Several groups came up with the idea of attaching a flotation device to the string connecting the turbidity sensor to the drone to (1) control for the depth at which the sensor was submerged and (2) potentially save the sensor from sinking to the bottom of the river channel if it were to be disconnected from the drone. Borrowing that idea, several of the SILT scientists purchased brightly colored children’s water wing flotation devices (), so they could have better control over submerging the sensor in the fast-moving water. In future versions of the SILT project, we plan to include more opportunities for students to test their model designs during scientists’ real data collection events to amplify their engagement in the project.
Figure 8. Left: SILT scientist J. Davis untangles the line connecting the drone to the turbidity sensor to prepare for the next test flight with the water wing flotation device prominently displayed. Right: The drone in flight with the water wing flotation device clearly visible.
Conclusion
The SILT project provided a unique opportunity for a homeschool student group and a middle school class located along the same river to study an underexplored phenomenon using novel research technologies. The geography of the river literally and figuratively brought together two student groups in partnership with a university, also located along the river, to test different strategies for measuring silt during winter and spring, during which it has been historically challenging to do so. This type of hands-on, locally relevant project in which students employ novel research technologies supports both their science interest and science self-efficacy development. Though the SILT project is focused on sedimentation in frozen boreal rivers, our educational model and tools are transferable to other environmental contexts. Sedimentation and its impact on water quality is a relevant issue to communities around the world, and our work demonstrates a promising approach to making this type of science research accessible and engaging for all students.
Supplemental Material: Pre-Program Youth Survey
Download MS Word (15 KB)Supplemental Material: Pre-Post Program Survey
Download MS Word (19.6 KB)Supplemental Material: SILT Post-Program Survey Results
Download MS Word (14.3 KB)Acknowledgments
We would like to thank J. Stone, B. Gerald, and their students for their participation in the SILT project. We would also like to thank Lillian Cooper (University of North Carolina at Chapel Hill) for assembling workshop materials, Emily Sousa (University of Alaska Fairbanks) for assisting in geospatial learning components of the project, Adrian Heath (Oregon State University) for assistance in running our third workshop, and Tohru Saito (University of Alaska Fairbanks) for arranging youth travel for the workshops.
Disclosure statement
No potential conflict of interest was reported by the authors.
Additional information
Funding
References
- Alsultan, J., M. Henderson, A. Feldman, M. Rice, X. Yang, J. Kahler, S. J. Ergas, and K. Ghebremichael. 2021. “Participation of High School Students in Authentic Science and Engineering Experiences with a University-Based Water Research Team.” Water 13 (13): 1745.
- Berland, L. K., C. V. Schwarz, C. Krist, L. Kenyon, A. S. Lo, and B. J. Reiser. 2016. “Epistemologies in Practice: Making Scientific Practices Meaningful for Students.” Journal of Research in Science Teaching 53 (7): 1082–1112.
- Carlone, H. B., and A. Johnson. 2007. “Understanding the Science Experiences of Successful Women of Color: Science Identity as an Analytic Lens.” Journal of Research in Science Teaching 44 (8): 1187–1218.
- Clement, S., K. Spellman, L. Oxtoby, K. Kealy, K. Bodony, E. Sparrow, and C. Arp. 2023. “Redistributing Power in Community and Citizen Science: Effects on Youth Science Self-Efficacy and Interest.” Sustainability 15 (11): 8876.
- Geldhof, G. J., D. A. Warner, J. K. Finders, A. A. Thogmartin, A. Clark, and K. A. Longway. 2018. “Revisiting the Utility of Retrospective Pre-Post Designs: The Need for Mixed-Method Pilot Data.” Evaluation and Program Planning 70: 83–89.
- Jones, M. G., K. Chesnutt, M. Ennes, K. L. Mulvey, and E. Cayton. 2021. “Understanding Science Career Aspirations: Factors Predicting Future Science Task Value.” Journal of Research in Science Teaching 58 (7): 937–955.
- Langhorst, T., T. Pavelsky, E. Eidam, L. Cooper, J. Davis, K. Spellman, S. Clement, et al. 2023. “Increased Scale and Accessibility of Sediment Transport Research in Rivers through Practical, Open-Source Turbidity and Depth Sensors.” Nature Water 1 (9): 760–768.
- Phillips, T., N. Porticella, M. Constas, and R. Bonney. 2018. “A Framework for Articulating and Measuring Individual Learning Outcomes from Participation in Citizen Science.” Citizen Science 3 (2): 3.
- Spellman, K. V., E. B. Sparrow, M. J. Chase, A. Larson, and K. Kealy. 2018. “Connected Climate Change Learning through Citizen Science: An Assessment of Priorities and Needs of Formal and Informal Educators and Community Members in Alaska.” Connected Science Learning 1 (6): 1–24.
- Tzou, C., E. Meixi, Suárez, P., Bell, D. LaBonte, E. Starks, and M. Bang. 2020. “Storywork in STEM-Art: Making, Materiality and Robotics within Everyday Acts of Indigenous Presence and Resurgence.” Cognition and Instruction 2020: 30–50.